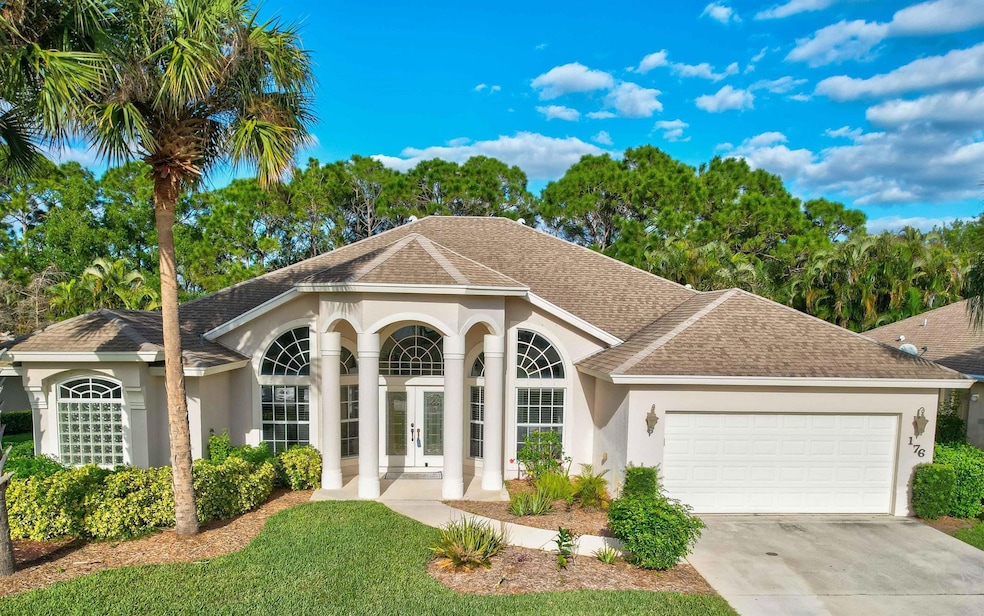
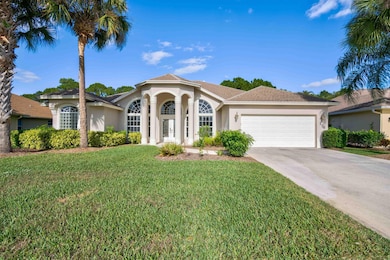


176 SW Fernleaf Trail Port Saint Lucie, FL 34953
Sawgrass Lakes NeighborhoodEstimated payment $3,830/month
Highlights
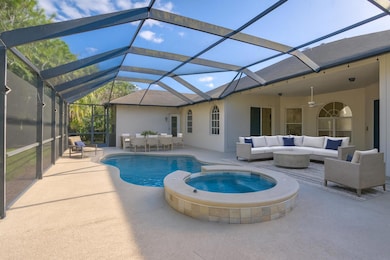
- Heated Spa
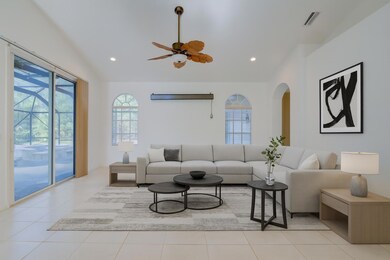
- Vaulted Ceiling
- Attic
- Gated Community
- Roman Tub
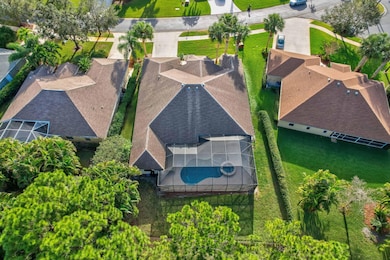
- Pool View
About This Home
This stunning home was built by Royal Professional Builders with poured concrete and insulated walls for lasting strength and efficiency. The popular Liberty model offers a spacious floorplan with 4 bedrooms plus a den that easily converts to a 5th bedroom, 3 full baths, and a 2-car garage.One of the baths doubles as a cabana bath with direct access to the screened-in pool and patio--perfect for entertaining. The kitchen has been recently upgraded with new quartz counters, stainless steel sink, modern faucet, and a custom tile backsplash.Inside, soaring ceilings and an open-concept layout create a light, airy feel that makes the home live even larger. Outside, enjoy the spacious fenced yard, covered and screened patio or take a dip in the custom-built pool with heated spa.
Home Details
Home Type
- Single Family
Est. Annual Taxes
- $4,922
Year Built
- Built in 2006
Lot Details
- 10,454 Sq Ft Lot
- Lot Dimensions are 66 x 91 x 138
- Interior Lot
- Irregular Lot
- Sprinkler System
HOA Fees
- $152 Monthly HOA Fees
Parking
- 2 Car Attached Garage
- Driveway
Home Design
- Shingle Roof
- Composition Roof
- Pre-Cast Concrete Construction
Interior Spaces
- 2,755 Sq Ft Home
- 1-Story Property
- Vaulted Ceiling
- Ceiling Fan
- Single Hung Metal Windows
- Arched Windows
- French Doors
- Great Room
- Family Room
- Formal Dining Room
- Den
- Pool Views
- Pull Down Stairs to Attic
Kitchen
- Electric Range
- Microwave
- Dishwasher
- Disposal
Flooring
- Laminate
- Ceramic Tile
- Vinyl
Bedrooms and Bathrooms
- 5 Bedrooms
- Split Bedroom Floorplan
- Walk-In Closet
- 3 Full Bathrooms
- Dual Sinks
- Roman Tub
- Separate Shower in Primary Bathroom
Laundry
- Dryer
- Washer
Home Security
- Home Security System
- Security Gate
Pool
- Heated Spa
- In Ground Spa
- Free Form Pool
- Gunite Pool
- Gunite Spa
- Screen Enclosure
Outdoor Features
- Patio
Schools
- Southport Middle School
- Treasure Coast High School
Utilities
- Central Heating and Cooling System
- Cable TV Available
Listing and Financial Details
- Assessor Parcel Number 442070200190003
- Seller Considering Concessions
Community Details
Overview
- Association fees include common areas
- Sawgrass Lakes Phase 2 Subdivision, Liberty Floorplan
Security
- Gated Community
Map
Home Values in the Area
Average Home Value in this Area
Tax History
| Year | Tax Paid | Tax Assessment Tax Assessment Total Assessment is a certain percentage of the fair market value that is determined by local assessors to be the total taxable value of land and additions on the property. | Land | Improvement |
|---|---|---|---|---|
| 2024 | $4,821 | $234,978 | -- | -- |
| 2023 | $4,821 | $228,134 | $0 | $0 |
| 2022 | $4,654 | $221,490 | $0 | $0 |
| 2021 | $4,591 | $215,039 | $0 | $0 |
| 2020 | $4,627 | $212,071 | $0 | $0 |
| 2019 | $4,589 | $207,304 | $0 | $0 |
| 2018 | $4,374 | $203,439 | $0 | $0 |
| 2017 | $4,394 | $251,000 | $42,000 | $209,000 |
| 2016 | $3,667 | $225,500 | $40,000 | $185,500 |
| 2015 | $3,706 | $206,400 | $32,000 | $174,400 |
| 2014 | $3,515 | $165,264 | $0 | $0 |
Property History
| Date | Event | Price | List to Sale | Price per Sq Ft |
|---|---|---|---|---|
| 10/07/2025 10/07/25 | For Sale | $620,000 | -- | $225 / Sq Ft |
Purchase History
| Date | Type | Sale Price | Title Company |
|---|---|---|---|
| Warranty Deed | $387,000 | Waveland Title Services Llc | |
| Warranty Deed | $269,700 | -- | |
| Warranty Deed | $640,400 | -- | |
| Quit Claim Deed | -- | -- | |
| Quit Claim Deed | -- | -- | |
| Quit Claim Deed | -- | -- | |
| Quit Claim Deed | -- | -- | |
| Quit Claim Deed | -- | -- |
Mortgage History
| Date | Status | Loan Amount | Loan Type |
|---|---|---|---|
| Open | $348,300 | Purchase Money Mortgage | |
| Previous Owner | $572,625 | Credit Line Revolving |
Source: BeachesMLS
MLS Number: R11130553
APN: 44-20-702-0019-0003
Disclaimer: Certain information contained herein is derived from information provided by parties other than Homes.com. All information provided is deemed reliable, but is not guaranteed to be accurate and should be independently verified.
![]() IDX information is provided exclusively for personal, non-commercial use, and may not be used for any purpose other than to identify prospective properties consumers may be interested in purchasing. Information is deemed reliable but not guaranteed.
IDX information is provided exclusively for personal, non-commercial use, and may not be used for any purpose other than to identify prospective properties consumers may be interested in purchasing. Information is deemed reliable but not guaranteed.
- 184 SW Fernleaf Trail
- 482 SW Tulip Blvd
- 310 SW Bridgeport Dr
- 476 SW Tulip Blvd
- 474 SW Tulip Blvd
- 488 SW Deer Run
- 3311 SW Ensley Ct
- 274 SW Bridgeport Dr
- 212 SW Whitewood Dr
- 156 SW Paar Dr
- 213 SW Whitewood Dr
- 121 SW Hawthorne Cir
- 365 SW Belmont Cir
- 165 SW Hawthorne Cir
- 3183 SW Ann Arbor Rd
- 3156 SW Ann Arbor Rd
- 152 SW Hawthorne Cir
- 243 SW Fernleaf Trail
- 2921 SW Massey Ln
- 126 SW Andover Ct
- 3331 SW Ensley Ct
- 255 SW Bridgeport Dr
- 212 SW Whitewood Dr
- 3183 SW Ann Arbor Rd
- 3090 SW Boxwood Cir
- 145 SW Hawthorne Cir
- 196 SW Paar Dr
- 388 SW Vista Lake Dr
- 499 SW Lairo Ave
- 591 SW Halifax Ave
- 3230 SE West Snow Rd
- 3681 SW Haines St
- 383 SW Tulip Blvd
- 2962 SW Coastal Terrace
- 3401 SW San Benito St
- 3413 SW San Benito St
- 3215 SE Pinto St
- 229 SW Kentwood Rd
- 614 SW Jeanne St
- 2901 SW Birtle Ct
