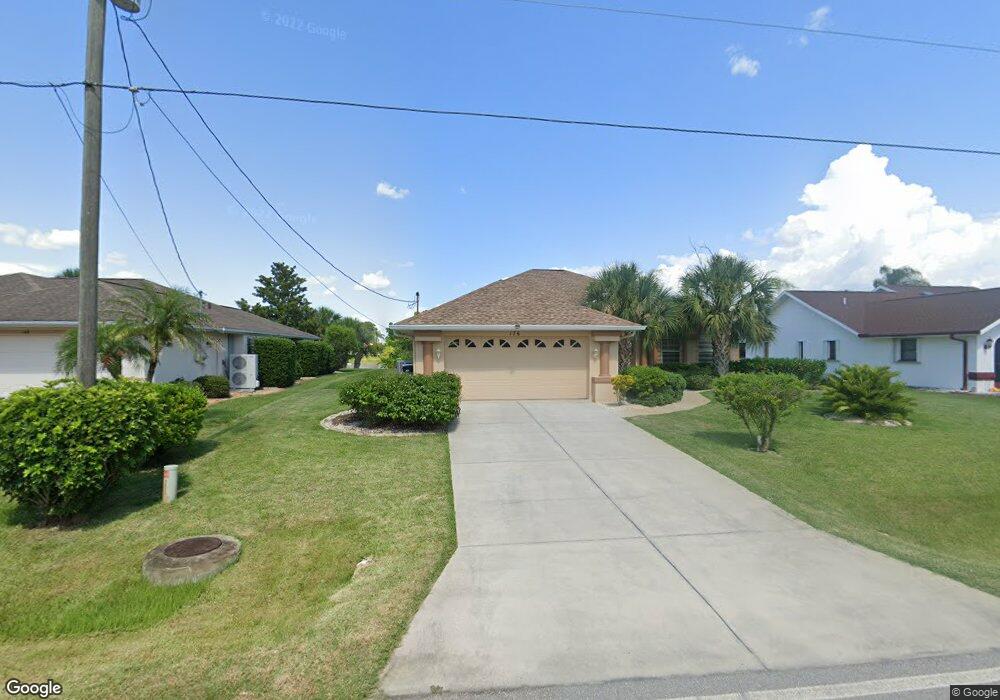
176 Torrington St Port Charlotte, FL 33954
Estimated Value: $394,595 - $478,000
3
Beds
2
Baths
2,986
Sq Ft
$142/Sq Ft
Est. Value
About This Home
This home is located at 176 Torrington St, Port Charlotte, FL 33954 and is currently estimated at $425,149, approximately $142 per square foot. 176 Torrington St is a home located in Charlotte County with nearby schools including Kingsway Elementary School, Port Charlotte Middle School, and Port Charlotte High School.
Ownership History
Date
Name
Owned For
Owner Type
Purchase Details
Closed on
Dec 4, 2012
Sold by
Goudie Allan and Banks Cherlyl
Bought by
Goudie Allan and Banks Cheryl
Current Estimated Value
Purchase Details
Closed on
Jan 21, 2008
Sold by
Kay Douglas R and Kay Fiona
Bought by
Amadi Benjiman and Amadi Olguine
Home Financials for this Owner
Home Financials are based on the most recent Mortgage that was taken out on this home.
Original Mortgage
$193,500
Outstanding Balance
$121,503
Interest Rate
6.06%
Mortgage Type
Purchase Money Mortgage
Estimated Equity
$303,646
Purchase Details
Closed on
Oct 29, 2002
Sold by
Costa Amelia G and Costa Nicholas J
Bought by
Kay Douglas R and Kay Fiona
Home Financials for this Owner
Home Financials are based on the most recent Mortgage that was taken out on this home.
Original Mortgage
$216,000
Interest Rate
6.01%
Purchase Details
Closed on
May 31, 1996
Sold by
Marlow E Carlton
Bought by
Costa Nicholas J and Costa Amelia G
Create a Home Valuation Report for This Property
The Home Valuation Report is an in-depth analysis detailing your home's value as well as a comparison with similar homes in the area
Home Values in the Area
Average Home Value in this Area
Purchase History
| Date | Buyer | Sale Price | Title Company |
|---|---|---|---|
| Goudie Allan | -- | Attorney | |
| Amadi Benjiman | $215,000 | Executive Title Ins Svcs Inc | |
| Kay Douglas R | $240,000 | -- | |
| Costa Nicholas J | $25,700 | -- |
Source: Public Records
Mortgage History
| Date | Status | Borrower | Loan Amount |
|---|---|---|---|
| Open | Amadi Benjiman | $193,500 | |
| Previous Owner | Kay Douglas R | $216,000 |
Source: Public Records
Tax History Compared to Growth
Tax History
| Year | Tax Paid | Tax Assessment Tax Assessment Total Assessment is a certain percentage of the fair market value that is determined by local assessors to be the total taxable value of land and additions on the property. | Land | Improvement |
|---|---|---|---|---|
| 2023 | $3,742 | $230,713 | $0 | $0 |
| 2022 | $3,614 | $223,993 | $0 | $0 |
| 2021 | $3,098 | $186,186 | $0 | $0 |
| 2020 | $2,512 | $151,813 | $0 | $0 |
| 2019 | $2,417 | $148,400 | $0 | $0 |
| 2018 | $2,226 | $145,633 | $0 | $0 |
| 2017 | $2,202 | $142,638 | $0 | $0 |
| 2016 | $2,187 | $139,704 | $0 | $0 |
| 2015 | $2,181 | $138,733 | $0 | $0 |
| 2014 | $3,274 | $163,967 | $0 | $0 |
Source: Public Records
Map
Nearby Homes
- 23136 Langdon Ave
- 23149 Hammond Ave
- 230 Viceroy Terrace
- 184 Robina St
- 23133 Lindale Ave
- 23117 Lindale Ave
- 23102 Madelyn Ave
- 23125 Hammond Ave
- 190 Rosemary St
- 23370 Garrison Ave
- 183 Appian St
- 158 Allworthy St
- 23348 Mullins Ave
- 23081 Ambassador Ave
- 23338 Duchess Ave
- 23088 Mineral Ave
- 23167 Turnbull Ave
- 23104 Turnbull Ave
- 23134 Madelyn Ave
- 72 Norman St
- 168 Torrington St
- 184 Torrington St
- 175 Torrington St
- 160 Torrington St
- 200 Torrington St
- 191 Torrington St
- 23173 Hillsdale Ave
- 23181 Corvin Ave
- 23168 Langdon Ave
- 23165 Hillsdale Ave
- 144 Torrington St
- 208 Torrington St
- 23173 Corvin Ave
- 216 Torrington St
- 23177 Langdon Ave
- 23160 Langdon Ave
- 23157 Hillsdale Ave
- 23165 Corvin Ave
- 23156 Hillsdale Ave