Estimated Value: $357,000 - $373,000
3
Beds
3
Baths
2,584
Sq Ft
$140/Sq Ft
Est. Value
About This Home
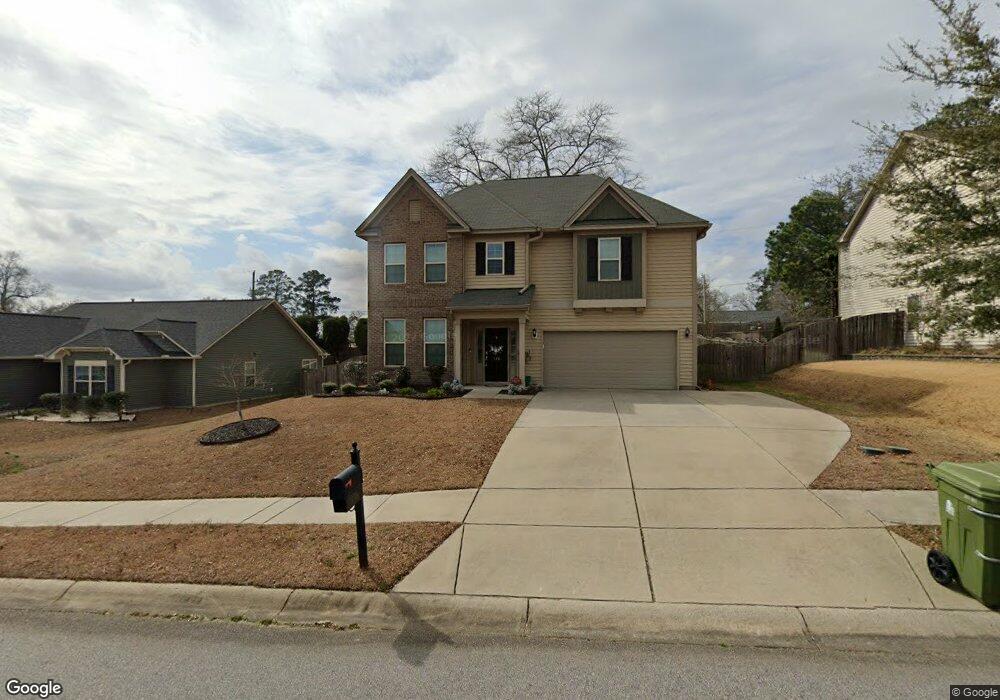
This home is located at 176 Tufton Ct, Cayce, SC 29033 and is currently estimated at $362,213, approximately $140 per square foot. 176 Tufton Ct is a home located in Lexington County with nearby schools including Cayce Elementary, Cyril B. Busbee Creative Arts Academy, and Brookland-Cayce High School.
Ownership History
Date
Name
Owned For
Owner Type
Purchase Details
Closed on
Sep 16, 2024
Sold by
Angello James D and Angello Dorothy M
Bought by
Angello Family Revocable Living Trust and Angello
Current Estimated Value
Purchase Details
Closed on
May 22, 2020
Sold by
Moberg Christopher Allen
Bought by
Nypaver Kaleb D and Carter Chelsea S
Home Financials for this Owner
Home Financials are based on the most recent Mortgage that was taken out on this home.
Original Mortgage
$234,778
Interest Rate
3.3%
Mortgage Type
VA
Purchase Details
Closed on
Jan 8, 2018
Sold by
Casper Andrew T
Bought by
Moberg Christopher Allen
Home Financials for this Owner
Home Financials are based on the most recent Mortgage that was taken out on this home.
Original Mortgage
$197,671
Interest Rate
3.9%
Mortgage Type
VA
Purchase Details
Closed on
May 28, 2014
Sold by
Mungo Homes Inc
Bought by
Casper Andrew T
Purchase Details
Closed on
Dec 31, 2013
Sold by
South Capital Group Inc
Bought by
Mungo Homes Inc
Create a Home Valuation Report for This Property
The Home Valuation Report is an in-depth analysis detailing your home's value as well as a comparison with similar homes in the area
Home Values in the Area
Average Home Value in this Area
Purchase History
| Date | Buyer | Sale Price | Title Company |
|---|---|---|---|
| Angello Family Revocable Living Trust | -- | None Listed On Document | |
| Nypaver Kaleb D | $229,500 | None Available | |
| Moberg Christopher Allen | $205,000 | None Available | |
| Casper Andrew T | $194,317 | -- | |
| Mungo Homes Inc | $352,000 | -- |
Source: Public Records
Mortgage History
| Date | Status | Borrower | Loan Amount |
|---|---|---|---|
| Previous Owner | Nypaver Kaleb D | $234,778 | |
| Previous Owner | Moberg Christopher Allen | $197,671 |
Source: Public Records
Tax History
| Year | Tax Paid | Tax Assessment Tax Assessment Total Assessment is a certain percentage of the fair market value that is determined by local assessors to be the total taxable value of land and additions on the property. | Land | Improvement |
|---|---|---|---|---|
| 2024 | $1,833 | $9,180 | $1,400 | $7,780 |
| 2023 | $1,656 | $9,180 | $1,400 | $7,780 |
| 2022 | $1,636 | $9,180 | $1,400 | $7,780 |
| 2020 | $1,567 | $8,200 | $1,400 | $6,800 |
| 2019 | $1,454 | $8,200 | $1,400 | $6,800 |
| 2018 | $1,362 | $7,773 | $1,400 | $6,373 |
| 2017 | $1,314 | $7,773 | $1,400 | $6,373 |
| 2016 | $1,337 | $7,772 | $1,400 | $6,372 |
| 2014 | $110 | $378 | $378 | $0 |
| 2013 | -- | $2,100 | $2,100 | $0 |
Source: Public Records
Map
Nearby Homes
- 411 Rocky Ln
- 135 Bonhill Dr
- 251 Tufton Ct
- 117 Bonhill Dr
- 2533 Tiffany Trail
- 2529 Stonehenge Dr
- 2518 Stonehenge Dr
- 1005 Sunnyside Dr
- 207 Haynes Ln
- 1512 Summerland Dr
- 226 Tamwood Cir
- 834 Moss Creek Dr
- 103 Pine Ln
- 722 Moss Creek Dr
- 215 Tamwood Cir
- 723 Moss Creek Dr
- 107 Cherry Ln
- 2402 Breezewood Rd
- 1137 Allen St
- 604 Moss Creek Dr
Your Personal Tour Guide
Ask me questions while you tour the home.