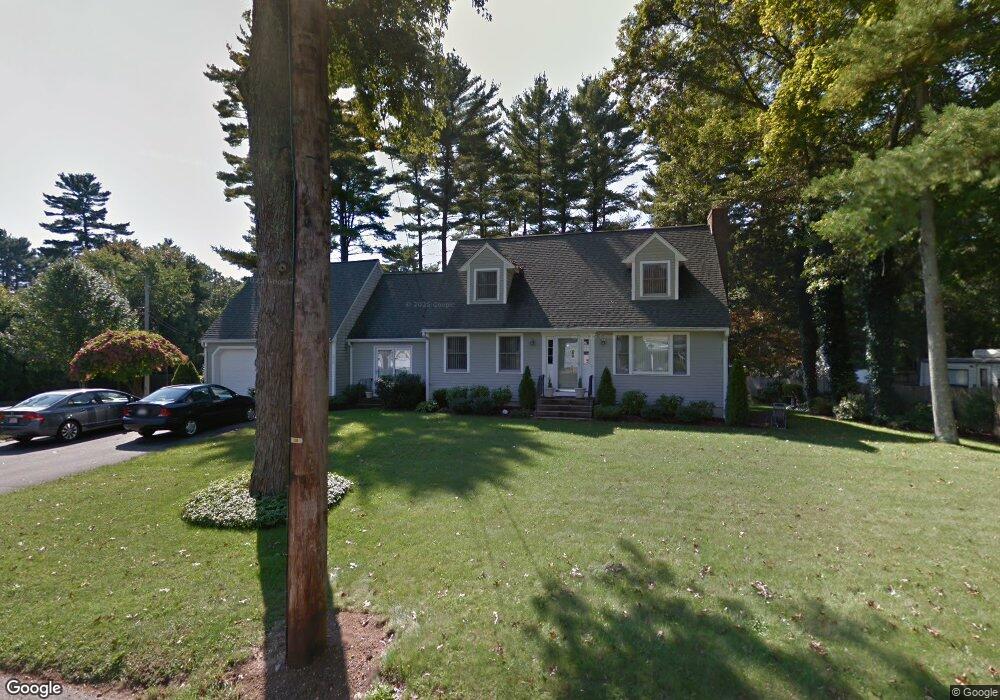
176 Wareham St Middleboro, MA 02346
Estimated Value: $523,000 - $636,000
3
Beds
2
Baths
1,684
Sq Ft
$347/Sq Ft
Est. Value
About This Home
This home is located at 176 Wareham St, Middleboro, MA 02346 and is currently estimated at $584,003, approximately $346 per square foot. 176 Wareham St is a home located in Plymouth County with nearby schools including Mary K. Goode Elementary School, Mullein Hill Christian Academy, and Samuel Fuller School.
Ownership History
Date
Name
Owned For
Owner Type
Purchase Details
Closed on
Jun 30, 2017
Sold by
Govoni Betty R and Tolias John C
Bought by
Ruggles-Tolias Betty and Tolias John C
Current Estimated Value
Purchase Details
Closed on
Dec 10, 2010
Sold by
Tolias John C
Bought by
Tolias John C and Govoni Betty R
Purchase Details
Closed on
Apr 6, 1988
Sold by
Pedro Vincent
Bought by
Tolias John C
Home Financials for this Owner
Home Financials are based on the most recent Mortgage that was taken out on this home.
Original Mortgage
$94,000
Interest Rate
9.89%
Mortgage Type
Purchase Money Mortgage
Create a Home Valuation Report for This Property
The Home Valuation Report is an in-depth analysis detailing your home's value as well as a comparison with similar homes in the area
Home Values in the Area
Average Home Value in this Area
Purchase History
| Date | Buyer | Sale Price | Title Company |
|---|---|---|---|
| Ruggles-Tolias Betty | -- | -- | |
| Tolias John C | -- | -- | |
| Tolias John C | $173,000 | -- |
Source: Public Records
Mortgage History
| Date | Status | Borrower | Loan Amount |
|---|---|---|---|
| Previous Owner | Tolias John C | $94,000 |
Source: Public Records
Tax History
| Year | Tax Paid | Tax Assessment Tax Assessment Total Assessment is a certain percentage of the fair market value that is determined by local assessors to be the total taxable value of land and additions on the property. | Land | Improvement |
|---|---|---|---|---|
| 2025 | $6,937 | $517,300 | $160,300 | $357,000 |
| 2024 | $6,654 | $491,400 | $152,700 | $338,700 |
| 2023 | $6,110 | $429,100 | $152,700 | $276,400 |
| 2022 | $5,492 | $357,100 | $132,800 | $224,300 |
| 2021 | $5,655 | $347,600 | $116,600 | $231,000 |
| 2020 | $5,337 | $336,100 | $116,600 | $219,500 |
| 2019 | $4,827 | $311,800 | $116,600 | $195,200 |
| 2018 | $4,872 | $312,300 | $110,800 | $201,500 |
| 2017 | $4,696 | $297,800 | $106,600 | $191,200 |
| 2016 | $4,337 | $272,400 | $97,800 | $174,600 |
| 2015 | $4,235 | $268,400 | $97,800 | $170,600 |
Source: Public Records
Map
Nearby Homes
- LOT A Wood St
- 26 Susan Ln
- 135 E Grove St
- 17 Cobblestone Ln
- 162 E Grove St
- 18 Rock St
- 0 Wareham Miller St Unit 73410845
- 6 Rock St
- 240 N Main St
- 15 E Grove St
- 129 Thomas St
- 308 Wood St
- 28 School St
- 7 Tispaquin St
- 87 Pearl St
- 17 Landing Way Unit 17
- 13 Beverly's Way Unit 13
- 1 Bloomfield Ave
- 75 Oak St
- 295 Cherry St
Your Personal Tour Guide
Ask me questions while you tour the home.