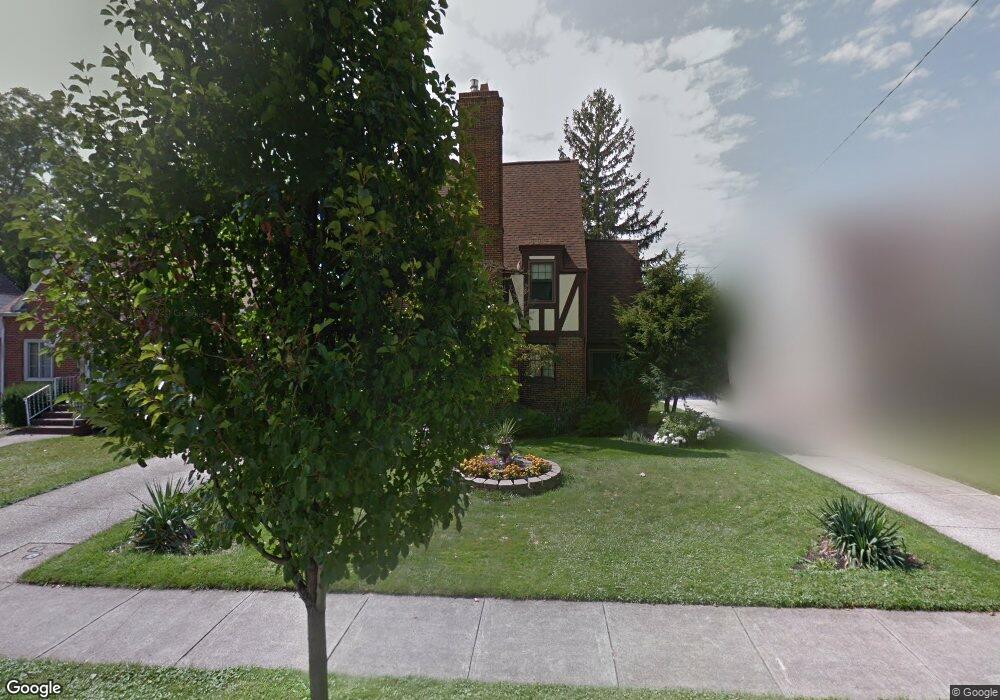
1760 E 238th St Euclid, OH 44117
Estimated Value: $164,000 - $190,000
3
Beds
1
Bath
1,588
Sq Ft
$113/Sq Ft
Est. Value
About This Home
This home is located at 1760 E 238th St, Euclid, OH 44117 and is currently estimated at $178,996, approximately $112 per square foot. 1760 E 238th St is a home located in Cuyahoga County with nearby schools including Thomas Jefferson Elementary School, Euclid Middle School, and Euclid High School.
Ownership History
Date
Name
Owned For
Owner Type
Purchase Details
Closed on
Mar 26, 2004
Sold by
Liptak Victoria M and Medved Ana
Bought by
Doblekar Mark P and Vibbert Grace M
Current Estimated Value
Home Financials for this Owner
Home Financials are based on the most recent Mortgage that was taken out on this home.
Original Mortgage
$101,200
Outstanding Balance
$47,889
Interest Rate
5.74%
Mortgage Type
Purchase Money Mortgage
Estimated Equity
$131,107
Purchase Details
Closed on
Apr 5, 1995
Sold by
Kenerson John E
Bought by
Medved Victoria and Medved Ana
Home Financials for this Owner
Home Financials are based on the most recent Mortgage that was taken out on this home.
Original Mortgage
$66,500
Interest Rate
8.79%
Mortgage Type
New Conventional
Purchase Details
Closed on
Aug 20, 1985
Sold by
Wata Sophie R
Bought by
Kenerson John E
Purchase Details
Closed on
Sep 26, 1980
Sold by
Wata Daniel B and Wata Sophia R
Bought by
Wata Sophie R
Purchase Details
Closed on
Jan 1, 1975
Bought by
Wata Daniel B and Wata Sophia R
Create a Home Valuation Report for This Property
The Home Valuation Report is an in-depth analysis detailing your home's value as well as a comparison with similar homes in the area
Home Values in the Area
Average Home Value in this Area
Purchase History
| Date | Buyer | Sale Price | Title Company |
|---|---|---|---|
| Doblekar Mark P | $126,500 | Executive Title Agency Corp | |
| Medved Victoria | $95,000 | -- | |
| Kenerson John E | $67,500 | -- | |
| Wata Sophie R | -- | -- | |
| Wata Daniel B | -- | -- |
Source: Public Records
Mortgage History
| Date | Status | Borrower | Loan Amount |
|---|---|---|---|
| Open | Doblekar Mark P | $101,200 | |
| Previous Owner | Medved Victoria | $66,500 | |
| Closed | Doblekar Mark P | $18,975 |
Source: Public Records
Tax History
| Year | Tax Paid | Tax Assessment Tax Assessment Total Assessment is a certain percentage of the fair market value that is determined by local assessors to be the total taxable value of land and additions on the property. | Land | Improvement |
|---|---|---|---|---|
| 2024 | $3,926 | $57,470 | $9,345 | $48,125 |
| 2023 | $3,525 | $41,100 | $7,320 | $33,780 |
| 2022 | $3,444 | $41,090 | $7,320 | $33,780 |
| 2021 | $3,840 | $41,090 | $7,320 | $33,780 |
| 2020 | $3,638 | $35,420 | $6,300 | $29,120 |
| 2019 | $3,274 | $101,200 | $18,000 | $83,200 |
| 2018 | $3,305 | $35,420 | $6,300 | $29,120 |
| 2017 | $3,437 | $30,740 | $5,080 | $25,660 |
| 2016 | $3,444 | $30,740 | $5,080 | $25,660 |
| 2015 | $3,133 | $30,740 | $5,080 | $25,660 |
| 2014 | $3,133 | $30,740 | $5,080 | $25,660 |
Source: Public Records
Map
Nearby Homes
- 1765 E 238th St
- 1754 E 236th St
- 24105 Chardon Rd
- 363 Balmoral Dr
- 21950 Euclid Ave
- 22791 Harms Rd
- 1934 Beverly Hills Dr
- 1554 E 221st St
- 22601 Harms Rd
- 25031 Glenbrook Blvd
- 1545 E 214th St
- 25550 Glenbrook Blvd
- 24691 Hawthorne Dr
- 1734 Glenridge Rd
- 24 Washington Square Unit 15
- 1790 Skyline Dr
- 24991 Euclid Ave
- 1807 Skyline Dr
- 24801 Highland Rd
- 25161 Euclid Ave
- 1754 E 238th St
- 1764 E 238th St
- 1770 E 238th St
- 1750 E 238th St
- 1761 E 236th St
- 1765 E 236th St
- 1774 E 238th St
- 1744 E 238th St
- 1755 E 236th St
- 1771 E 236th St
- 1761 E 238th St
- 1771 E 238th St
- 1751 E 236th St
- 1740 E 238th St
- 1780 E 238th St
- 1779 E 236th St
- 1751 E 238th St
- 1775 E 238th St
- 1755 E 238th St
- 1745 E 238th St
Your Personal Tour Guide
Ask me questions while you tour the home.