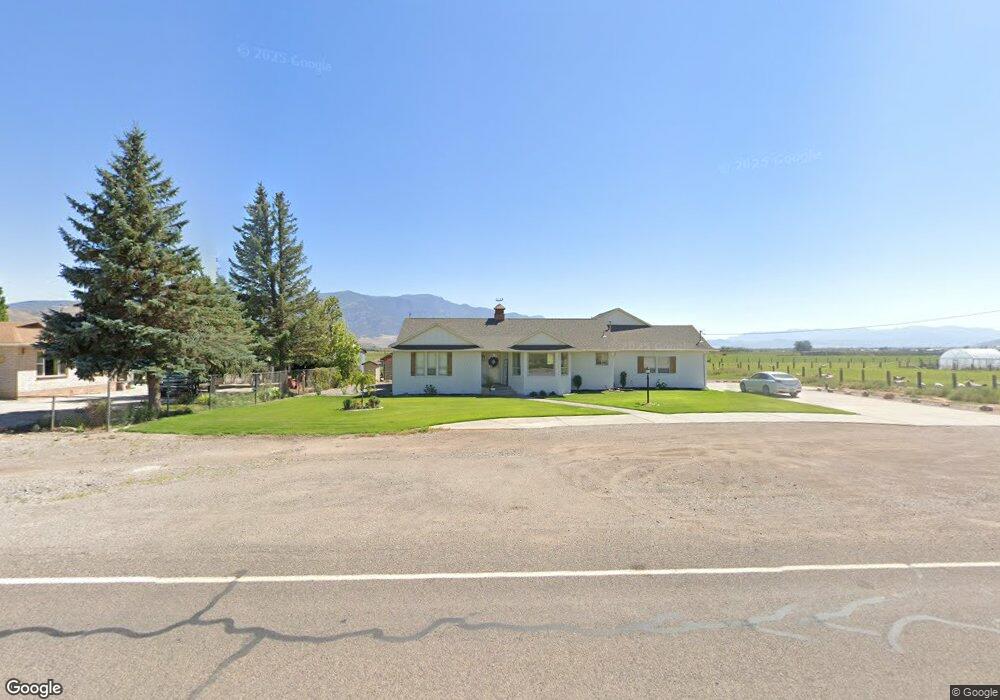
1760 E Sr 119 Richfield, UT 84701
Estimated Value: $468,923 - $724,000
Studio
--
Bath
2,673
Sq Ft
$234/Sq Ft
Est. Value
About This Home
This home is located at 1760 E Sr 119, Richfield, UT 84701 and is currently estimated at $625,231, approximately $233 per square foot. 1760 E Sr 119 is a home located in Sevier County with nearby schools including Pahvant School, Ashman School, and Red Hills Middle School.
Ownership History
Date
Name
Owned For
Owner Type
Purchase Details
Closed on
Apr 9, 2021
Sold by
Kyhl Gary W and Kyhl Margaret G
Bought by
Anderson Jed
Current Estimated Value
Home Financials for this Owner
Home Financials are based on the most recent Mortgage that was taken out on this home.
Original Mortgage
$355,500
Outstanding Balance
$318,335
Interest Rate
2.9%
Mortgage Type
New Conventional
Estimated Equity
$306,896
Purchase Details
Closed on
Sep 9, 2015
Sold by
Kyhl Gary W and Anderson Jacquelyn V
Bought by
Kyhl Gary W and Kyhl Margaret G
Create a Home Valuation Report for This Property
The Home Valuation Report is an in-depth analysis detailing your home's value as well as a comparison with similar homes in the area
Purchase History
| Date | Buyer | Sale Price | Title Company |
|---|---|---|---|
| Anderson Jed | -- | Access Title Company | |
| Kyhl Gary W | -- | Utah Title & Abstract |
Source: Public Records
Mortgage History
| Date | Status | Borrower | Loan Amount |
|---|---|---|---|
| Open | Anderson Jed | $355,500 |
Source: Public Records
Tax History
| Year | Tax Paid | Tax Assessment Tax Assessment Total Assessment is a certain percentage of the fair market value that is determined by local assessors to be the total taxable value of land and additions on the property. | Land | Improvement |
|---|---|---|---|---|
| 2025 | $2,157 | $259,695 | $44,000 | $215,695 |
| 2024 | $2,157 | $257,151 | $38,500 | $218,651 |
| 2023 | $2,182 | $287,852 | $36,685 | $251,167 |
| 2022 | $2,231 | $229,063 | $30,800 | $198,263 |
| 2021 | $1,856 | $159,020 | $29,700 | $129,320 |
| 2020 | $1,672 | $134,965 | $18,044 | $116,921 |
| 2019 | $1,538 | $133,040 | $18,040 | $115,000 |
| 2018 | $1,587 | $122,130 | $18,040 | $104,090 |
| 2017 | $1,469 | $107,590 | $15,040 | $92,550 |
| 2016 | $1,056 | $107,590 | $0 | $0 |
| 2015 | $1,056 | $100,480 | $0 | $0 |
| 2014 | $1,056 | $100,480 | $0 | $0 |
Source: Public Records
Map
Nearby Homes
Your Personal Tour Guide
Ask me questions while you tour the home.