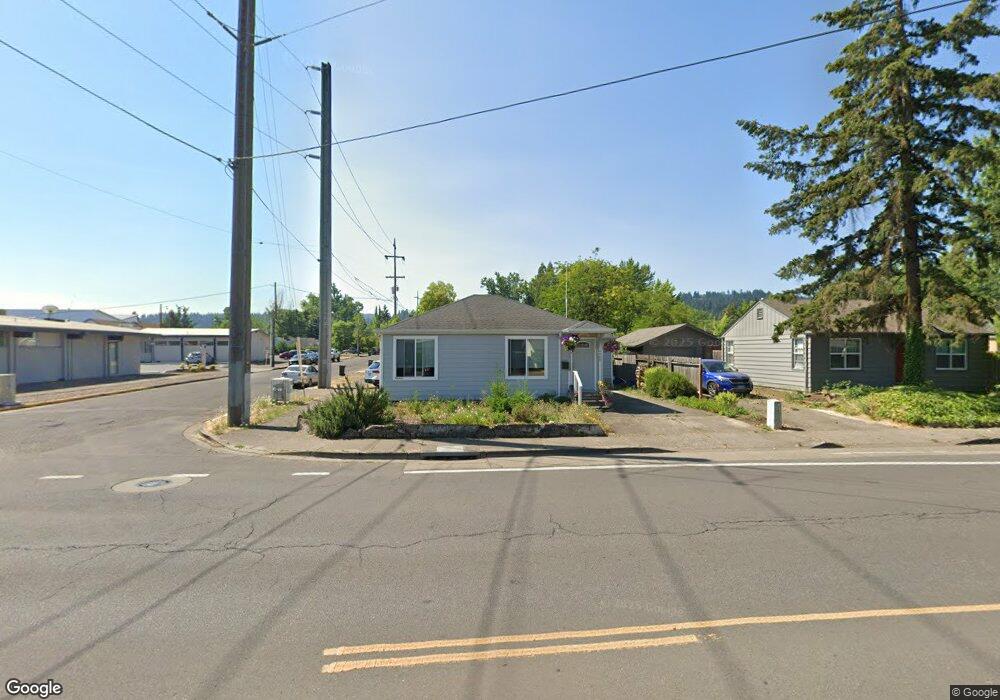
1760 W 18th Ave Eugene, OR 97402
Far West NeighborhoodEstimated Value: $327,000 - $453,000
4
Beds
2
Baths
1,475
Sq Ft
$267/Sq Ft
Est. Value
About This Home
This home is located at 1760 W 18th Ave, Eugene, OR 97402 and is currently estimated at $394,321, approximately $267 per square foot. 1760 W 18th Ave is a home located in Lane County with nearby schools including Cesar Chavez Elementary School, Arts And Technology Academy At Jefferson, and Churchill High School.
Ownership History
Date
Name
Owned For
Owner Type
Purchase Details
Closed on
Feb 26, 2018
Sold by
Hoppe Gary August and Hoppe Judith Ann
Bought by
Fong Chokman and Liu Sara Ya
Current Estimated Value
Home Financials for this Owner
Home Financials are based on the most recent Mortgage that was taken out on this home.
Original Mortgage
$217,500
Outstanding Balance
$183,352
Interest Rate
3.99%
Mortgage Type
New Conventional
Estimated Equity
$210,969
Purchase Details
Closed on
Feb 22, 2018
Sold by
Hoppe Gary August and Hoppe Judith Ann
Bought by
Fong Chokman and Lu Liu Sara Ya
Home Financials for this Owner
Home Financials are based on the most recent Mortgage that was taken out on this home.
Original Mortgage
$217,500
Outstanding Balance
$183,352
Interest Rate
3.99%
Mortgage Type
New Conventional
Estimated Equity
$210,969
Purchase Details
Closed on
Jan 20, 2005
Sold by
Hoppe Gary August and Hoppe Judith Ann
Bought by
Hoppe Gary August and Hoppe Judith Ann
Home Financials for this Owner
Home Financials are based on the most recent Mortgage that was taken out on this home.
Original Mortgage
$132,000
Interest Rate
1.37%
Mortgage Type
FHA
Purchase Details
Closed on
Nov 13, 2002
Sold by
Purcell Jean Marie
Bought by
Hoppe Gary A and Hoppe Judith
Home Financials for this Owner
Home Financials are based on the most recent Mortgage that was taken out on this home.
Original Mortgage
$130,500
Interest Rate
5.95%
Create a Home Valuation Report for This Property
The Home Valuation Report is an in-depth analysis detailing your home's value as well as a comparison with similar homes in the area
Home Values in the Area
Average Home Value in this Area
Purchase History
| Date | Buyer | Sale Price | Title Company |
|---|---|---|---|
| Fong Chokman | $290,000 | Fidelity National Title | |
| Fong Chokman | $290,000 | Fidelity National Title | |
| Hoppe Gary August | -- | Fidelity National Title Insu | |
| Hoppe Gary A | $145,000 | Western Title & Escrow Compa |
Source: Public Records
Mortgage History
| Date | Status | Borrower | Loan Amount |
|---|---|---|---|
| Open | Fong Chokman | $217,500 | |
| Closed | Fong Chokman | $217,500 | |
| Previous Owner | Hoppe Gary August | $132,000 | |
| Previous Owner | Hoppe Gary A | $130,500 |
Source: Public Records
Tax History
| Year | Tax Paid | Tax Assessment Tax Assessment Total Assessment is a certain percentage of the fair market value that is determined by local assessors to be the total taxable value of land and additions on the property. | Land | Improvement |
|---|---|---|---|---|
| 2025 | $4,952 | $254,159 | -- | -- |
| 2024 | $4,890 | $246,757 | -- | -- |
| 2023 | $4,890 | $239,570 | $0 | $0 |
| 2022 | $4,581 | $232,593 | $0 | $0 |
| 2021 | $4,303 | $225,819 | $0 | $0 |
| 2020 | $4,318 | $219,242 | $0 | $0 |
| 2019 | $4,171 | $212,857 | $0 | $0 |
| 2018 | $3,926 | $169,671 | $0 | $0 |
| 2017 | $3,171 | $169,671 | $0 | $0 |
| 2016 | $3,064 | $164,729 | $0 | $0 |
| 2015 | $2,968 | $159,931 | $0 | $0 |
| 2014 | $2,927 | $155,273 | $0 | $0 |
Source: Public Records
Map
Nearby Homes
- 1910 W 17th Ave
- 1674 Hayes St Unit B
- 1943 W 17th Ave Unit A
- 2064 Grant St
- 2064 W 17th Ave
- 2070 W 16th Way
- 1579 Garfield Place Unit 1579
- 1890 Taylor St
- 1735 Cleveland Place
- 1612 Polk St
- 2115 Arthur St
- 2161 W 16th Ave
- 2132 W 14th Ct
- 1890 W 12th Ave
- 2279 City View St
- 2230 Cleveland St
- 2255 Polk St
- 1130 Polk Aly
- 1445 W 11th Ave
- 1740 W Broadway
- 1810 Pierce St
- 1770 W 18th Ave
- 1820 Pierce St
- 1780 W 18th Ave
- 1830 Pierce St
- 1790 W 18th Ave
- 1765 W 18th Ave Unit VRM
- 1765 W 18th Ave
- 1825 Grant St
- 1876 Pierce St
- 1775 W 18th Ave
- 1794 W 18th Ave
- 1851 Grant St
- 1785 W 18th Ave
- 1890 Pierce St
- 1889 Grant St
- 1795 W 18th Ave
- 1760 W 17th Ave
- 1727 Grant St
- 1901 Grant St
Your Personal Tour Guide
Ask me questions while you tour the home.