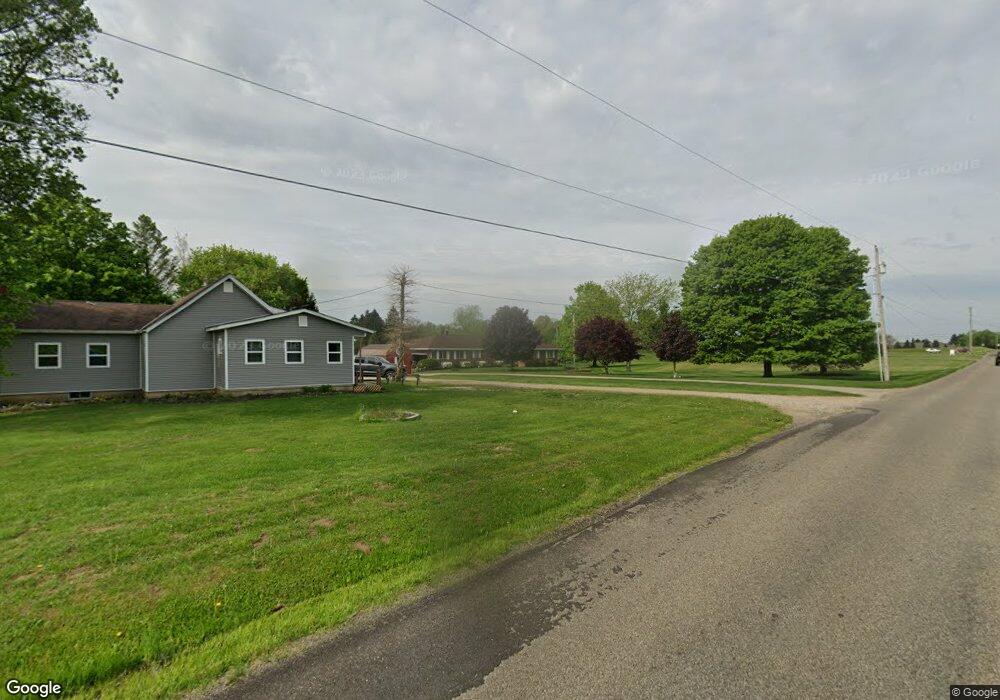
17600 Yauger Rd Mount Vernon, OH 43050
Estimated Value: $419,000 - $508,000
3
Beds
3
Baths
1,890
Sq Ft
$239/Sq Ft
Est. Value
About This Home
This home is located at 17600 Yauger Rd, Mount Vernon, OH 43050 and is currently estimated at $452,475, approximately $239 per square foot. 17600 Yauger Rd is a home located in Knox County with nearby schools including Mount Vernon High School, St. Vincent de Paul School, and Christian Star Academy.
Ownership History
Date
Name
Owned For
Owner Type
Purchase Details
Closed on
Jun 22, 2016
Bought by
Hammond Kimberley D
Current Estimated Value
Home Financials for this Owner
Home Financials are based on the most recent Mortgage that was taken out on this home.
Original Mortgage
$205,000
Outstanding Balance
$162,998
Interest Rate
3.54%
Estimated Equity
$289,477
Purchase Details
Closed on
Jun 21, 2016
Sold by
Hammond Robert L
Bought by
Kimberley D Hammond and Shawn R Hammond
Home Financials for this Owner
Home Financials are based on the most recent Mortgage that was taken out on this home.
Original Mortgage
$205,000
Outstanding Balance
$162,998
Interest Rate
3.54%
Estimated Equity
$289,477
Purchase Details
Closed on
Jun 25, 1987
Sold by
Fawcett Melvin L and Jean E
Bought by
Hammond Robert L and Hammond Debra
Purchase Details
Closed on
Apr 2, 1987
Sold by
Hare Richard J
Bought by
Fawcett Melvin L and Fawcett Jean E
Create a Home Valuation Report for This Property
The Home Valuation Report is an in-depth analysis detailing your home's value as well as a comparison with similar homes in the area
Home Values in the Area
Average Home Value in this Area
Purchase History
| Date | Buyer | Sale Price | Title Company |
|---|---|---|---|
| Hammond Kimberley D | -- | -- | |
| Kimberley D Hammond | $240,000 | -- | |
| Hammond Robert L | $7,000 | -- | |
| Fawcett Melvin L | $4,500 | -- |
Source: Public Records
Mortgage History
| Date | Status | Borrower | Loan Amount |
|---|---|---|---|
| Open | Kimberley D Hammond | $205,000 | |
| Closed | Kimberley D Hammond | -- | |
| Closed | Kimberley D Hammond | -- |
Source: Public Records
Tax History Compared to Growth
Tax History
| Year | Tax Paid | Tax Assessment Tax Assessment Total Assessment is a certain percentage of the fair market value that is determined by local assessors to be the total taxable value of land and additions on the property. | Land | Improvement |
|---|---|---|---|---|
| 2024 | $4,618 | $128,080 | $19,620 | $108,460 |
| 2023 | $4,618 | $128,080 | $19,620 | $108,460 |
| 2022 | $2,993 | $88,330 | $13,530 | $74,800 |
| 2021 | $2,993 | $82,450 | $13,530 | $68,920 |
| 2020 | $2,920 | $82,450 | $13,530 | $68,920 |
| 2019 | $3,602 | $74,350 | $12,950 | $61,400 |
| 2018 | $3,603 | $74,350 | $12,950 | $61,400 |
| 2017 | $3,544 | $74,350 | $12,950 | $61,400 |
| 2016 | $2,883 | $68,840 | $11,990 | $56,850 |
| 2015 | $2,895 | $68,840 | $11,990 | $56,850 |
| 2014 | $2,908 | $68,840 | $11,990 | $56,850 |
| 2013 | $2,959 | $68,150 | $11,270 | $56,880 |
Source: Public Records
Map
Nearby Homes
- 84 Woodlake Trail
- 42 Wildwood Ln
- 0 Wildwood Ln
- 0 Venture Dr Unit 20240369
- 55 Wildwood Ln
- 17375 Gambier Rd
- 60 Wildwood Ln
- 17421 Coshocton Rd
- 2 Coventry Ct W
- 2 Coventry Ct
- 207 Tamarack Dr
- 104 Colonial Woods Dr Unit 4
- 17980 Gambier Rd
- 117 Colonial Woods Dr
- 188 Plymouth Rd
- 17 Upland Terrace
- 200 Eastwood Dr
- 301 Teryl Dr
- 6 Fairway Dr
- 2 Frary Ct
- 17576 Yauger Rd
- 17638 Yauger Rd
- 17686 Yauger Rd
- 11186 Pineview Ln
- 11050 Upper Gilchrist Rd
- 11176 Upper Gilchrist Rd
- 11195 Pineview Ln
- 11201 Upper Gilchrist Rd
- 11170 Pineview Ln
- 72 Woodberry Dr
- 76 Woodberry Dr
- 64 Woodberry Dr
- 68 Woodberry Dr
- 0 Upper Gilchrist Rd Unit 3929341
- 11080 Upper Gilchrist Rd
- 74 Woodberry Dr
- 56 Woodberry Dr
- 11359 Upper Gilchrist Rd
- 78 Woodberry Dr
- 52 Woodberry Dr