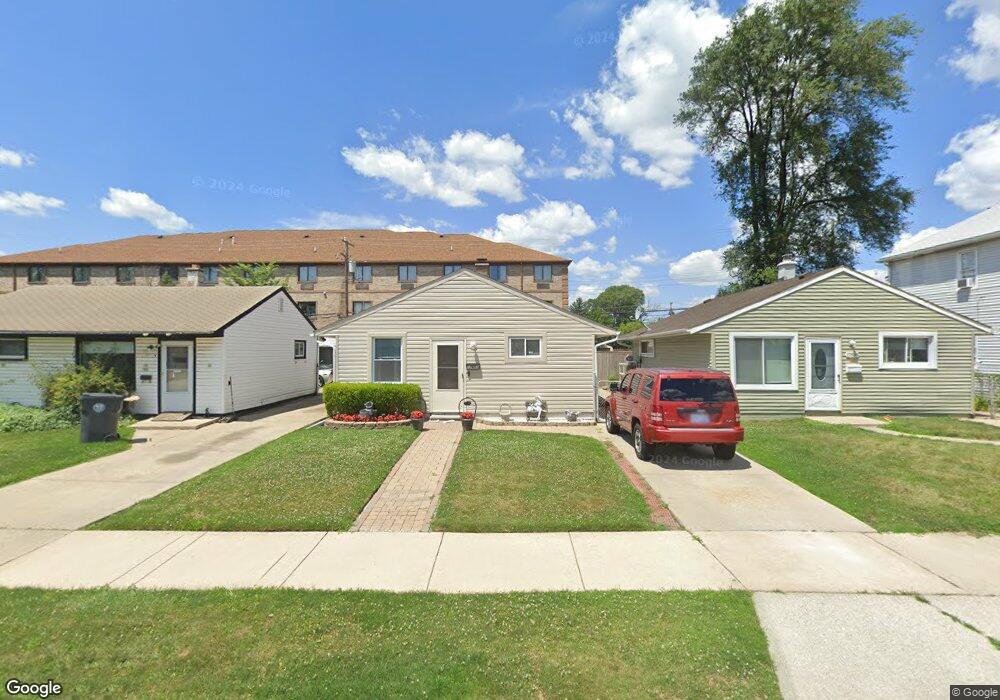
17601 Clarann St Melvindale, MI 48122
Estimated Value: $96,127 - $103,000
2
Beds
1
Bath
720
Sq Ft
$137/Sq Ft
Est. Value
About This Home
This home is located at 17601 Clarann St, Melvindale, MI 48122 and is currently estimated at $98,282, approximately $136 per square foot. 17601 Clarann St is a home located in Wayne County with nearby schools including Rogers Early Elementary School, Allendale Elementary School, and Julian O. Strong Middle School.
Ownership History
Date
Name
Owned For
Owner Type
Purchase Details
Closed on
Jun 2, 2018
Sold by
Vargas Jesus Urbina
Bought by
Vargas Jesus Urbina and Cordes Padilla Griselda Jazmin
Current Estimated Value
Purchase Details
Closed on
Jun 11, 2013
Sold by
Urbina Hugo and Urbina Rita
Bought by
Urbina Vargas Jesus
Purchase Details
Closed on
Oct 18, 2010
Sold by
Nunez Jose Luis and Nunez Maribel
Bought by
Nunez Jose Luis and Nunez Maribel
Purchase Details
Closed on
Feb 22, 2010
Sold by
Citimortgage Inc
Bought by
Department Of Veterans Affairs
Purchase Details
Closed on
Feb 3, 2010
Sold by
Johnson Anthony and Johnson Anthony L
Bought by
Citimortgage Inc
Purchase Details
Closed on
May 23, 2006
Sold by
Topping Jeanette and Evans Patricia
Bought by
Johnson Anthony
Purchase Details
Closed on
Jan 28, 2005
Sold by
Topping Jeanette and Topping William J
Bought by
Topping Jeanette
Create a Home Valuation Report for This Property
The Home Valuation Report is an in-depth analysis detailing your home's value as well as a comparison with similar homes in the area
Home Values in the Area
Average Home Value in this Area
Purchase History
| Date | Buyer | Sale Price | Title Company |
|---|---|---|---|
| Vargas Jesus Urbina | -- | None Available | |
| Urbina Vargas Jesus | $9,000 | None Available | |
| Nunez Jose Luis | -- | None Available | |
| Department Of Veterans Affairs | -- | None Available | |
| Citimortgage Inc | $8,813 | None Available | |
| Johnson Anthony | $62,000 | Multiple | |
| Topping Jeanette | -- | -- |
Source: Public Records
Tax History Compared to Growth
Tax History
| Year | Tax Paid | Tax Assessment Tax Assessment Total Assessment is a certain percentage of the fair market value that is determined by local assessors to be the total taxable value of land and additions on the property. | Land | Improvement |
|---|---|---|---|---|
| 2025 | $566 | $46,000 | $0 | $0 |
| 2024 | $566 | $38,700 | $0 | $0 |
| 2023 | $539 | $31,700 | $0 | $0 |
| 2022 | $1,048 | $28,500 | $0 | $0 |
| 2021 | $1,015 | $24,300 | $0 | $0 |
| 2020 | $1,012 | $20,600 | $0 | $0 |
| 2019 | $938 | $19,100 | $0 | $0 |
| 2018 | $561 | $17,400 | $0 | $0 |
| 2017 | $696 | $14,900 | $0 | $0 |
| 2016 | $889 | $14,200 | $0 | $0 |
| 2015 | $1,290 | $13,000 | $0 | $0 |
| 2013 | $1,320 | $13,200 | $0 | $0 |
| 2012 | $572 | $12,900 | $1,800 | $11,100 |
Source: Public Records
Map
Nearby Homes
- 17206 Flora St
- 17150 Flora St
- 17172 Eddon St
- 17579 Park St
- 17083 Dora St
- 2326 Fisher St
- 2527 Corbin St
- 3589 Caryn St
- 3595 Elizabeth St
- 0002 Prospect St
- 0001 Prospect St
- 17951 Prospect St
- 2800 David St
- 2523 David St
- 18028 Ruth St
- 2573 Grace St
- 17632 Henry St
- 17182 Henry St
- 12836 Conway St
- 2790 Blanche St
- 17595 Clarann St
- 17589 Clarann St
- 17581 Clarann St
- 17611 Clarann St
- 17619 Clarann St
- 17627 Clarann St
- 17580 Clarann St
- 17590 Clarann St
- 17570 Clarann St
- 17560 Clarann St
- 17633 Clarann St
- 17600 Clarann St
- 17553 Clarann St
- 17641 Clarann St
- 17647 Clarann St
- 17550 Clarann St
- 17610 Clarann St
- 17655 Clarann St
- 17591 Dora St
- 17581 Dora St