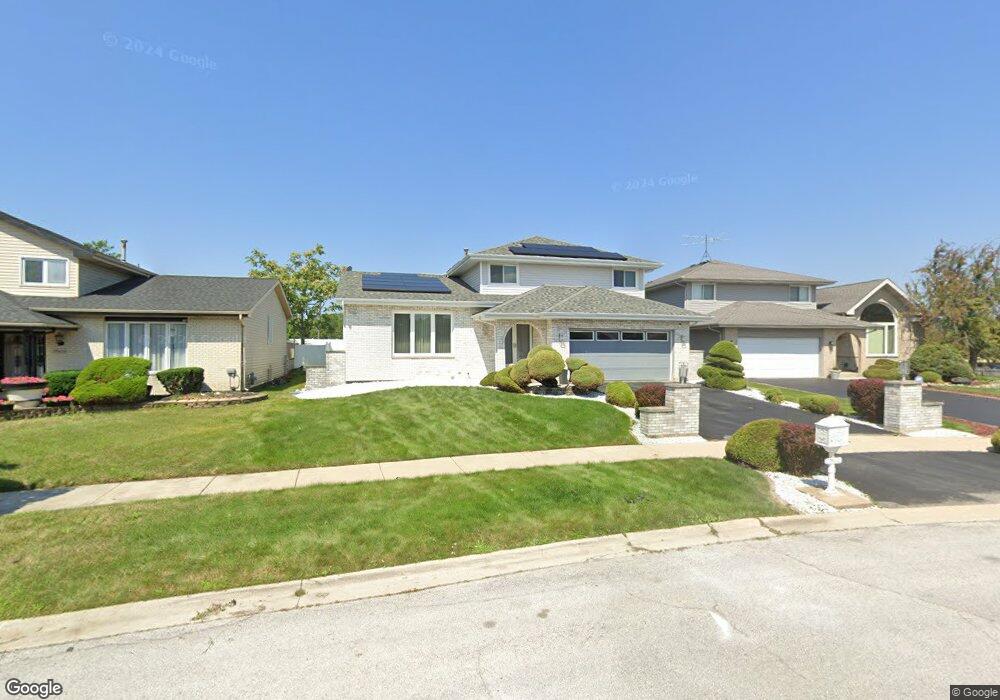
17602 Arlington Ln Hazel Crest, IL 60429
Stonebridge NeighborhoodEstimated Value: $260,000 - $357,000
3
Beds
3
Baths
2,478
Sq Ft
$124/Sq Ft
Est. Value
About This Home
This home is located at 17602 Arlington Ln, Hazel Crest, IL 60429 and is currently estimated at $307,541, approximately $124 per square foot. 17602 Arlington Ln is a home located in Cook County with nearby schools including Mae Jemison School, Prairie-Hills Junior High School, and Hillcrest High School.
Ownership History
Date
Name
Owned For
Owner Type
Purchase Details
Closed on
Dec 29, 2006
Sold by
Plummer Mark
Bought by
Plummer Mark and Plummer Yvonne
Current Estimated Value
Home Financials for this Owner
Home Financials are based on the most recent Mortgage that was taken out on this home.
Original Mortgage
$204,000
Outstanding Balance
$126,983
Interest Rate
7.35%
Mortgage Type
New Conventional
Estimated Equity
$180,558
Purchase Details
Closed on
Jan 14, 2002
Sold by
Chicago Title Land Trust Company
Bought by
Plummer Mark
Home Financials for this Owner
Home Financials are based on the most recent Mortgage that was taken out on this home.
Original Mortgage
$221,523
Interest Rate
7.24%
Mortgage Type
FHA
Purchase Details
Closed on
Aug 12, 1994
Sold by
Burnett Lillie
Bought by
Chicago Title & Trust Company
Purchase Details
Closed on
Nov 10, 1993
Sold by
Beverly Trust Company
Bought by
Burnett Lillie
Create a Home Valuation Report for This Property
The Home Valuation Report is an in-depth analysis detailing your home's value as well as a comparison with similar homes in the area
Home Values in the Area
Average Home Value in this Area
Purchase History
We collect this data history from publicly available records. To have your information removed, we recommend requesting removal directly through your county’s website.
| Date | Buyer | Sale Price | Title Company |
|---|---|---|---|
| Plummer Mark | -- | Stewart Title Of Illinois | |
| Plummer Mark | $225,000 | -- | |
| Chicago Title & Trust Company | -- | -- | |
| Burnett Lillie | $103,333 | -- |
Source: Public Records
Mortgage History
We collect this data history from publicly available records. To have your information removed, we recommend requesting removal directly through your county’s website.
| Date | Status | Borrower | Loan Amount |
|---|---|---|---|
| Open | Plummer Mark | $204,000 | |
| Closed | Plummer Mark | $221,523 |
Source: Public Records
Tax History
| Year | Tax Paid | Tax Assessment Tax Assessment Total Assessment is a certain percentage of the fair market value that is determined by local assessors to be the total taxable value of land and additions on the property. | Land | Improvement |
|---|---|---|---|---|
| 2025 | $11,621 | $26,000 | $3,941 | $22,059 |
| 2024 | $11,621 | $26,000 | $3,941 | $22,059 |
| 2023 | $7,282 | $26,000 | $3,941 | $22,059 |
| 2022 | $7,282 | $13,341 | $3,477 | $9,864 |
| 2021 | $7,082 | $13,340 | $3,477 | $9,863 |
| 2020 | $6,877 | $13,340 | $3,477 | $9,863 |
| 2019 | $7,144 | $14,099 | $3,245 | $10,854 |
| 2018 | $6,919 | $14,099 | $3,245 | $10,854 |
| 2017 | $7,206 | $15,263 | $3,245 | $12,018 |
| 2016 | $7,290 | $14,965 | $2,781 | $12,184 |
| 2015 | $6,913 | $14,965 | $2,781 | $12,184 |
| 2014 | $6,772 | $14,965 | $2,781 | $12,184 |
| 2013 | $5,638 | $14,403 | $2,781 | $11,622 |
Source: Public Records
Map
Nearby Homes
- 17723 Stonebridge Dr
- 17807 Stonebridge Dr
- 17718 Ridgewood Dr
- 5 E Carriageway Dr Unit 308
- 5 E Carriageway Dr Unit 201
- 5 E Carriageway Dr Unit 210
- 3006 Buttonwood Walk
- 17405 Longfellow Ave
- 17417 Kedzie Ave
- 17607 Stonebridge Dr
- 17410 Emerson Ave
- 17616 Grandview Dr
- 17312 Poe Ave
- 3307 Fountainbleau Dr
- 2900 175th St
- 17800 Dogwood Ln
- 2808 Cherrywood Ln
- 17803 Dogwood Ln
- 3107 173rd St
- 3009 Longfellow Ave
- 17612 Arlington Ln
- 17614 Arlington Ln
- 17610 Arlington Ln
- 17616 Arlington Ln
- 17608 Arlington Ln
- 17700 Arlington Ln
- 17606 Arlington Ln
- 17611 Arlington Ln
- 17613 Arlington Ln
- 17609 Arlington Ln
- 17615 Arlington Ln
- 17615 Arlington Ln
- 17607 Arlington Ln
- 17604 Arlington Ln
- 17702 Arlington Ln
- 17605 Arlington Ln
- 17680 Kedzie Ave Unit 102
- 17503 Kedzie Ave Unit 75
- 3115 Surrey Ln
- 17603 Arlington Ln
Your Personal Tour Guide
Ask me questions while you tour the home.