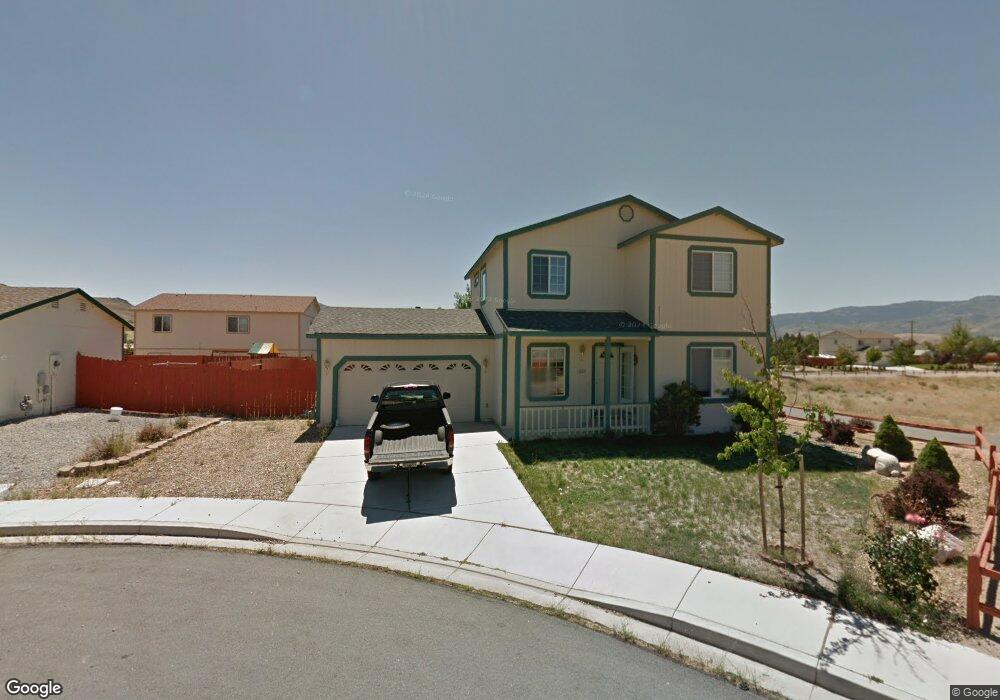
17602 Javalina Ct Reno, NV 89508
Cold Springs NeighborhoodEstimated Value: $420,488 - $440,000
3
Beds
3
Baths
1,624
Sq Ft
$266/Sq Ft
Est. Value
About This Home
This home is located at 17602 Javalina Ct, Reno, NV 89508 and is currently estimated at $431,622, approximately $265 per square foot. 17602 Javalina Ct is a home located in Washoe County with nearby schools including Cold Springs Middle Schools and North Valleys High School.
Ownership History
Date
Name
Owned For
Owner Type
Purchase Details
Closed on
Apr 27, 2007
Sold by
Sommers Jeffrey L and Sommers Karen
Bought by
Sommers Jeffrey L and Sommers Karen
Current Estimated Value
Purchase Details
Closed on
Feb 7, 2005
Sold by
Davis Alan D and Davis Barbara M
Bought by
Sommers Jeffrey L and Sommers Karen
Home Financials for this Owner
Home Financials are based on the most recent Mortgage that was taken out on this home.
Original Mortgage
$207,200
Outstanding Balance
$96,061
Interest Rate
4.43%
Mortgage Type
Negative Amortization
Estimated Equity
$335,561
Purchase Details
Closed on
Jun 25, 2001
Sold by
Woodland Village Homes Inc
Bought by
Davis Alan D and Davis Barbara M
Home Financials for this Owner
Home Financials are based on the most recent Mortgage that was taken out on this home.
Original Mortgage
$125,069
Interest Rate
7.14%
Mortgage Type
FHA
Create a Home Valuation Report for This Property
The Home Valuation Report is an in-depth analysis detailing your home's value as well as a comparison with similar homes in the area
Home Values in the Area
Average Home Value in this Area
Purchase History
| Date | Buyer | Sale Price | Title Company |
|---|---|---|---|
| Sommers Jeffrey L | -- | None Available | |
| Sommers Jeffrey L | $259,000 | Founders Title Company Of Nv | |
| Davis Alan D | $128,500 | First American Title |
Source: Public Records
Mortgage History
| Date | Status | Borrower | Loan Amount |
|---|---|---|---|
| Open | Sommers Jeffrey L | $207,200 | |
| Previous Owner | Davis Alan D | $125,069 |
Source: Public Records
Tax History Compared to Growth
Tax History
| Year | Tax Paid | Tax Assessment Tax Assessment Total Assessment is a certain percentage of the fair market value that is determined by local assessors to be the total taxable value of land and additions on the property. | Land | Improvement |
|---|---|---|---|---|
| 2025 | $1,440 | $91,758 | $31,654 | $60,104 |
| 2024 | $1,440 | $86,136 | $25,669 | $60,467 |
| 2023 | $0 | $83,193 | $29,526 | $53,667 |
| 2022 | $1,295 | $69,710 | $24,938 | $44,772 |
| 2021 | $1,257 | $64,443 | $19,983 | $44,460 |
| 2020 | $1,220 | $63,758 | $19,119 | $44,639 |
| 2019 | $1,183 | $61,191 | $18,022 | $43,169 |
| 2018 | $1,149 | $55,151 | $13,067 | $42,084 |
| 2017 | $1,116 | $54,091 | $11,937 | $42,154 |
| 2016 | $1,088 | $53,122 | $10,840 | $42,282 |
| 2015 | $814 | $50,346 | $8,811 | $41,535 |
| 2014 | $1,053 | $39,042 | $7,049 | $31,993 |
| 2013 | -- | $31,565 | $4,988 | $26,577 |
Source: Public Records
Map
Nearby Homes
- 17533 Javalina Ct
- 17523 Javalina Ct
- 17507 Bear Lake Dr
- 17862 Bear River Ct
- 17702 Clear Springs Ct
- 115 Calistoga Ct
- 18260 Alderwood Ct
- 17160 Amethyst Dr
- 3865 Fulmar Ct
- 17105 Garnet Dr
- 17475 Egret Ln
- 17530 Thrush Ln
- 4040 Goldfinch Dr
- 17570 Thrush Ln
- 18197 Almondleaf Ct
- 17710 Fairfax Ct
- 3830 Petrel Ct
- 3800 Sandpiper Dr
- 17870 Fantail Cir
- 3810 Bobolink Cir
- 17592 Javalina Ct
- 17417 Bear Lake Dr
- 17407 Bear Lake Dr
- 17593 Javalina Ct
- 17582 Javalina Ct
- 17603 Javalina Ct
- 17397 Bear Lake Dr
- 17583 Javalina Ct
- 17572 Javalina Ct
- 17387 Bear Lake Dr
- 17418 Bear Lake Dr
- 17718 Feather River Ct
- 17708 Feather River Ct
- 17398 Bear Lake Dr
- 17573 Javalina Ct
- 17562 Javalina Ct
- 17698 Feather River Ct
- 17428 Bear Lake Dr
- 17377 Bear Lake Dr
- 17563 Javalina Ct