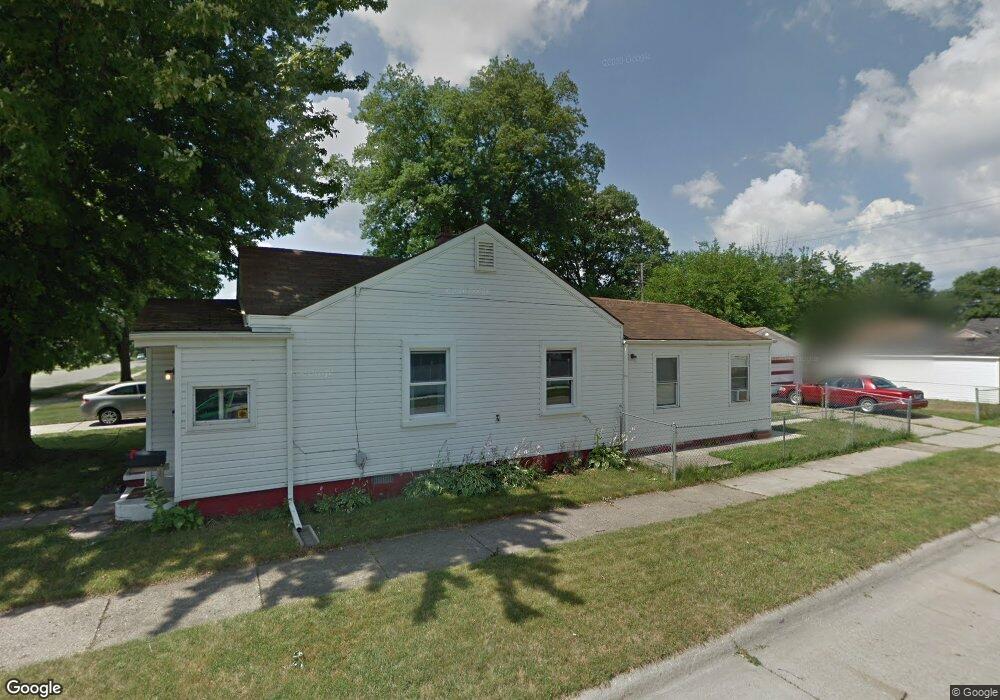
17605 Hanna St Unit Bldg-Unit Melvindale, MI 48122
Estimated Value: $119,000 - $158,389
Studio
1
Bath
956
Sq Ft
$148/Sq Ft
Est. Value
About This Home
This home is located at 17605 Hanna St Unit Bldg-Unit, Melvindale, MI 48122 and is currently estimated at $141,097, approximately $147 per square foot. 17605 Hanna St Unit Bldg-Unit is a home located in Wayne County with nearby schools including Rogers Early Elementary School, Allendale Elementary School, and Julian O. Strong Middle School.
Ownership History
Date
Name
Owned For
Owner Type
Purchase Details
Closed on
Sep 19, 2014
Sold by
Mhoder Mohammed
Bought by
Amh Property Management Llc
Current Estimated Value
Purchase Details
Closed on
Jan 30, 2014
Sold by
Secretary Of Housing & Urban Development
Bought by
Mhoder Mohammad
Purchase Details
Closed on
Nov 29, 2013
Sold by
Suntrust Mortgage Inc
Bought by
The Secretary Of Housing & Urban Develop
Purchase Details
Closed on
Apr 25, 2013
Sold by
Novak Lawrence P and Harper Melissa A
Bought by
Suntrust Mortgage Inc
Purchase Details
Closed on
Apr 15, 2005
Sold by
Stonge John R and Stonge Cheryl
Bought by
Novak Lawrence P
Purchase Details
Closed on
May 30, 2002
Sold by
Colon Jose M
Bought by
St Onge John R
Purchase Details
Closed on
May 2, 2002
Sold by
Colon Jose M
Bought by
Banc One Financial Services Inc
Purchase Details
Closed on
Sep 20, 1999
Sold by
Sanchez Eddy Sanchez
Bought by
Colon Jose M
Create a Home Valuation Report for This Property
The Home Valuation Report is an in-depth analysis detailing your home's value as well as a comparison with similar homes in the area
Home Values in the Area
Average Home Value in this Area
Purchase History
| Date | Buyer | Sale Price | Title Company |
|---|---|---|---|
| Amh Property Management Llc | -- | None Available | |
| Mhoder Mohammad | $23,419 | Active Title Agency | |
| The Secretary Of Housing & Urban Develop | -- | None Available | |
| Suntrust Mortgage Inc | $75,235 | None Available | |
| Novak Lawrence P | $81,500 | Multiple | |
| St Onge John R | $73,000 | -- | |
| Banc One Financial Services Inc | $57,527 | -- | |
| Colon Jose M | $65,200 | -- |
Source: Public Records
Tax History
| Year | Tax Paid | Tax Assessment Tax Assessment Total Assessment is a certain percentage of the fair market value that is determined by local assessors to be the total taxable value of land and additions on the property. | Land | Improvement |
|---|---|---|---|---|
| 2025 | $1,473 | $75,700 | $0 | $0 |
| 2024 | $1,430 | $66,400 | $0 | $0 |
| 2023 | $1,360 | $57,900 | $0 | $0 |
| 2022 | $2,356 | $44,700 | $0 | $0 |
| 2021 | $2,068 | $40,700 | $0 | $0 |
| 2020 | $2,494 | $39,400 | $0 | $0 |
| 2019 | $1,928 | $33,000 | $0 | $0 |
| 2018 | $1,305 | $27,200 | $0 | $0 |
| 2017 | $1,133 | $24,200 | $0 | $0 |
| 2016 | $1,830 | $22,900 | $0 | $0 |
| 2015 | $2,100 | $21,000 | $0 | $0 |
| 2013 | $2,150 | $21,500 | $0 | $0 |
| 2012 | $928 | $21,200 | $3,400 | $17,800 |
Source: Public Records
Map
Nearby Homes
- 17621 Hanna St
- 17646 Wood St
- 17709 Hanna St
- 17345 Hanna St
- 17632 Henry St
- 17169 Harman St
- 18022 Harman St
- 17506 Reed St
- 18254 Harman St
- 3595 Elizabeth St
- 18295 Henry St
- 3511 Elizabeth St
- 3492 Elizabeth St
- 3525 Whitaker Dr Unit 68
- 18557 Harman St
- 3296 Wilkerson Cir Unit 175
- 18591 Harman St
- 18624 Hanna St
- 18634 Wood St
- 3082 Lindenwood Dr
- 17605 Hanna St
- 17611 Hanna St
- 17602 Harman St
- 17460 Harman St
- 17610 Harman St
- 17455 Hanna St
- 17618 Harman St
- 17637 Hanna St
- 17604 Hanna St
- 17630 Harman St
- 17610 Hanna St
- 17447 Hanna St
- 17454 Harman St
- 17620 Hanna St
- 17460 Hanna St
- 17645 Hanna St Unit Bldg-Unit
- 17645 Hanna St
- 17628 Hanna St
- 17446 Harman St
- 17644 Harman St
Your Personal Tour Guide
Ask me questions while you tour the home.