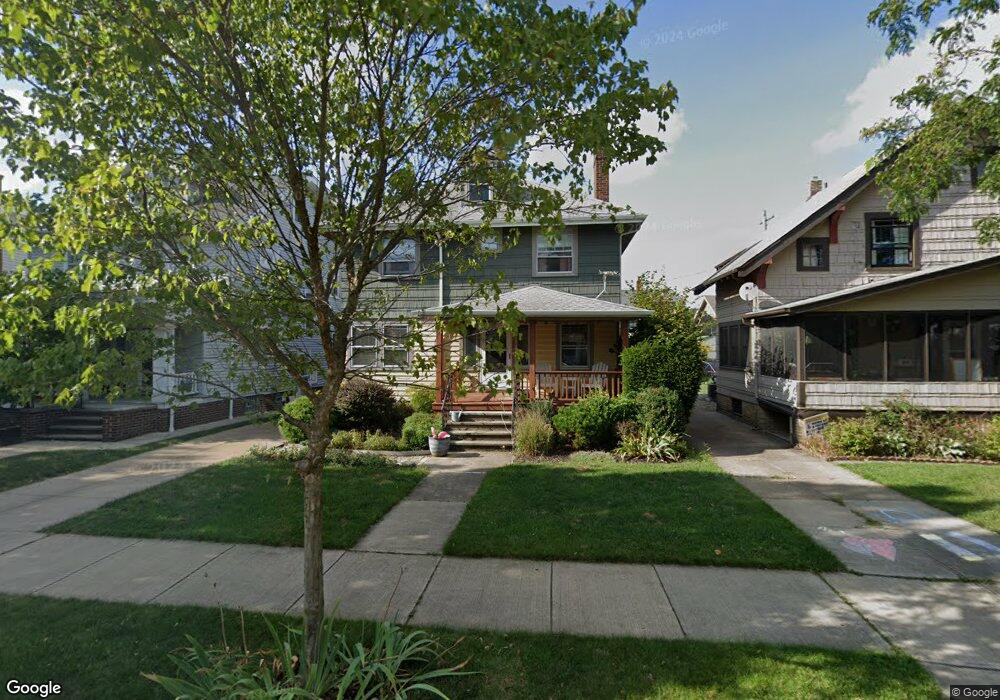
17608 Fries Ave Lakewood, OH 44107
Estimated Value: $306,000 - $391,000
4
Beds
1
Bath
1,486
Sq Ft
$235/Sq Ft
Est. Value
About This Home
This home is located at 17608 Fries Ave, Lakewood, OH 44107 and is currently estimated at $349,646, approximately $235 per square foot. 17608 Fries Ave is a home located in Cuyahoga County with nearby schools including Horace Mann Elementary School, Harding Middle School, and Lakewood High School.
Ownership History
Date
Name
Owned For
Owner Type
Purchase Details
Closed on
Mar 27, 2008
Sold by
Drews Valerie and Kundrik Albert P
Bought by
Astrop Wendell E and Astrop Nicole F
Current Estimated Value
Home Financials for this Owner
Home Financials are based on the most recent Mortgage that was taken out on this home.
Original Mortgage
$150,312
Outstanding Balance
$94,319
Interest Rate
5.79%
Mortgage Type
FHA
Estimated Equity
$255,327
Purchase Details
Closed on
Dec 13, 2003
Sold by
Pribanic Mark and Pribanic Mary L
Bought by
Drews Valerie
Home Financials for this Owner
Home Financials are based on the most recent Mortgage that was taken out on this home.
Original Mortgage
$106,200
Interest Rate
5.25%
Mortgage Type
Purchase Money Mortgage
Purchase Details
Closed on
Nov 17, 1975
Sold by
Sminchak Joseph A and Sminchak Barbara
Bought by
Pribanic Mark and Pribanic Mary L
Purchase Details
Closed on
Jan 1, 1975
Bought by
Sminchak Joseph A and Sminchak Barbara
Create a Home Valuation Report for This Property
The Home Valuation Report is an in-depth analysis detailing your home's value as well as a comparison with similar homes in the area
Home Values in the Area
Average Home Value in this Area
Purchase History
| Date | Buyer | Sale Price | Title Company |
|---|---|---|---|
| Astrop Wendell E | $151,500 | Title Xperts Agency Inc | |
| Drews Valerie | $118,000 | Grimsley Title Agency | |
| Pribanic Mark | $32,000 | -- | |
| Sminchak Joseph A | -- | -- |
Source: Public Records
Mortgage History
| Date | Status | Borrower | Loan Amount |
|---|---|---|---|
| Open | Astrop Wendell E | $150,312 | |
| Closed | Drews Valerie | $106,200 |
Source: Public Records
Tax History Compared to Growth
Tax History
| Year | Tax Paid | Tax Assessment Tax Assessment Total Assessment is a certain percentage of the fair market value that is determined by local assessors to be the total taxable value of land and additions on the property. | Land | Improvement |
|---|---|---|---|---|
| 2024 | $6,286 | $97,860 | $19,215 | $78,645 |
| 2023 | $5,336 | $71,090 | $14,840 | $56,250 |
| 2022 | $5,370 | $71,090 | $14,840 | $56,250 |
| 2021 | $5,315 | $71,090 | $14,840 | $56,250 |
| 2020 | $4,715 | $55,130 | $11,520 | $43,610 |
| 2019 | $4,622 | $157,500 | $32,900 | $124,600 |
| 2018 | $4,442 | $55,130 | $11,520 | $43,610 |
| 2017 | $4,300 | $46,660 | $9,450 | $37,210 |
| 2016 | $4,270 | $46,660 | $9,450 | $37,210 |
| 2015 | $4,041 | $46,660 | $9,450 | $37,210 |
| 2014 | $4,041 | $42,430 | $8,580 | $33,850 |
Source: Public Records
Map
Nearby Homes
- 17322 Archdale Ave
- 1482 Rockway Ave
- 2111 Overbrook Ave
- 1462 Spring Garden Ave
- 1615 Wagar Ave
- 1563 Wagar Ave
- 1500 Lauderdale Ave
- 1464 Riverside Dr
- 1431 Maile Ave
- 1420 Cordova Ave
- 1422 Gridley St
- 2192 Glenbury Ave
- 1416 Rio St
- 1354 Webb Rd
- 1547 Orchard Grove Ave
- 2099 Olive Ave
- 2209 Woodward Ave
- 1437 Woodward Ave
- 2223 Eldred Ave
- 1507 Orchard Grove Ave
- 17604 Fries Ave
- 17614 Fries Ave
- 17600 Fries Ave
- 17616 Fries Ave
- 17611 Archdale Ave
- 17702 Fries Ave
- 17615 Archdale Ave
- 17605 Archdale Ave
- 17520 Fries Ave
- 17611 Fries Ave
- 17621 Archdale Ave
- 17613 Fries Ave
- 17605 Fries Ave
- 17617 Fries Ave
- 17601 Fries Ave
- 17625 Archdale Ave
- 17519 Archdale Ave
- 17701 Fries Ave
- 17516 Fries Ave
- 17521 Fries Ave