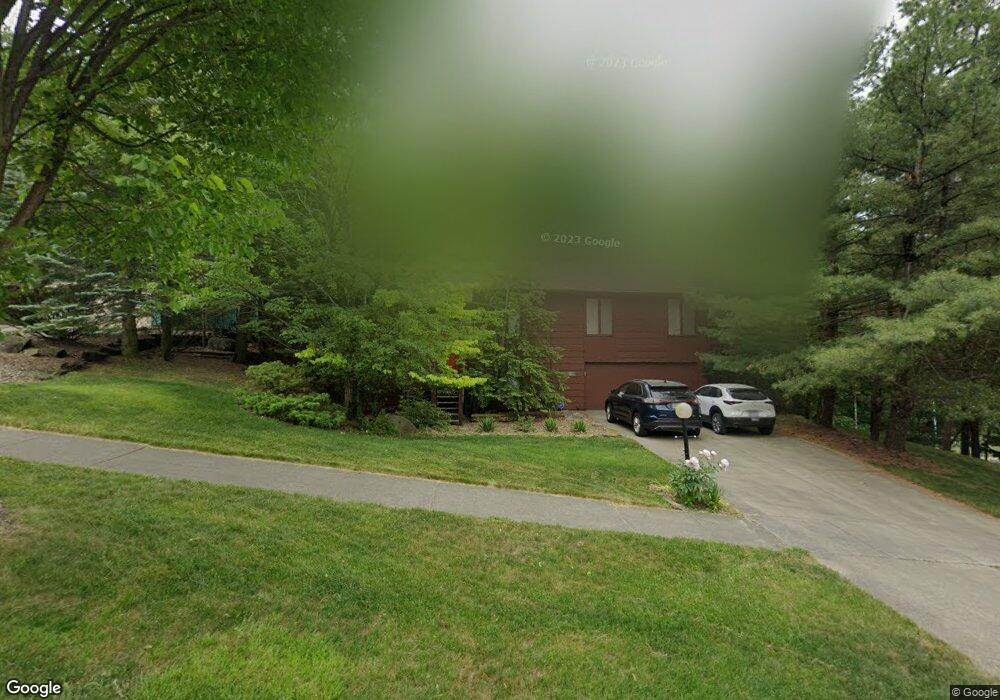
17609 Falling Water Rd Strongsville, OH 44136
Estimated Value: $382,781 - $456,000
3
Beds
3
Baths
2,658
Sq Ft
$158/Sq Ft
Est. Value
About This Home
This home is located at 17609 Falling Water Rd, Strongsville, OH 44136 and is currently estimated at $420,695, approximately $158 per square foot. 17609 Falling Water Rd is a home located in Cuyahoga County with nearby schools including Strongsville High School, Sts Joseph & John Interparochial School, and Royal Redeemer Lutheran School.
Ownership History
Date
Name
Owned For
Owner Type
Purchase Details
Closed on
Dec 5, 1998
Sold by
Demartini Kevin T and Demartini Karen L
Bought by
Doll Ronald E and Doll Connie B
Current Estimated Value
Home Financials for this Owner
Home Financials are based on the most recent Mortgage that was taken out on this home.
Original Mortgage
$164,000
Outstanding Balance
$38,769
Interest Rate
7.25%
Mortgage Type
Purchase Money Mortgage
Estimated Equity
$381,926
Purchase Details
Closed on
Aug 18, 1994
Sold by
Korom Steve
Bought by
Demartini Karen T and Demartini Karen L
Home Financials for this Owner
Home Financials are based on the most recent Mortgage that was taken out on this home.
Original Mortgage
$145,500
Interest Rate
8.73%
Mortgage Type
New Conventional
Purchase Details
Closed on
May 16, 1990
Sold by
Stephen J Korom
Bought by
Korom Steve
Purchase Details
Closed on
Apr 5, 1982
Sold by
Korom Margaret G
Bought by
Stephen J Korom
Purchase Details
Closed on
Jan 1, 1975
Bought by
Korom Margaret G
Create a Home Valuation Report for This Property
The Home Valuation Report is an in-depth analysis detailing your home's value as well as a comparison with similar homes in the area
Home Values in the Area
Average Home Value in this Area
Purchase History
| Date | Buyer | Sale Price | Title Company |
|---|---|---|---|
| Doll Ronald E | $205,000 | Midland Title Security Inc | |
| Demartini Karen T | $161,750 | -- | |
| Korom Steve | -- | -- | |
| Stephen J Korom | -- | -- | |
| Korom Margaret G | -- | -- |
Source: Public Records
Mortgage History
| Date | Status | Borrower | Loan Amount |
|---|---|---|---|
| Open | Doll Ronald E | $164,000 | |
| Closed | Demartini Karen T | $145,500 |
Source: Public Records
Tax History Compared to Growth
Tax History
| Year | Tax Paid | Tax Assessment Tax Assessment Total Assessment is a certain percentage of the fair market value that is determined by local assessors to be the total taxable value of land and additions on the property. | Land | Improvement |
|---|---|---|---|---|
| 2024 | $4,795 | $102,130 | $19,880 | $82,250 |
| 2023 | $5,203 | $83,100 | $20,550 | $62,550 |
| 2022 | $5,166 | $83,090 | $20,550 | $62,550 |
| 2021 | $5,125 | $83,090 | $20,550 | $62,550 |
| 2020 | $4,749 | $68,110 | $16,840 | $51,280 |
| 2019 | $4,609 | $194,600 | $48,100 | $146,500 |
| 2018 | $4,160 | $68,110 | $16,840 | $51,280 |
| 2017 | $4,215 | $63,530 | $14,040 | $49,490 |
| 2016 | $4,180 | $63,530 | $14,040 | $49,490 |
| 2015 | $4,116 | $63,530 | $14,040 | $49,490 |
| 2014 | $4,116 | $61,680 | $13,620 | $48,060 |
Source: Public Records
Map
Nearby Homes
- 17809 Cliffside Dr Unit 4926
- 17945 Cliffside Dr
- 12101 The Bluffs
- 18248 Meadow Ln
- 18336 Falling Water Rd
- 17289 Akita Ct Unit 4508
- 17281 Akita Ct Unit 4506
- 11650 River Moss Rd
- 13513 Suncrest Ct
- 16519 Albion Rd
- 11499 Pearl Rd Unit A106
- 11479 Pearl Rd Unit A101
- 11432 Pearl Rd
- 13099 Olympus Way
- 13066 Olympus Way
- 13156 Olympus Way
- 12539 Olympus Way
- 19160 Wheelers Ln
- 19240 Briarwood Ln
- 12385 Corinth Ct
- 17571 Falling Water Rd
- 17535 Falling Water Rd
- 12674 Moss Point Rd
- 17501 Falling Water Rd
- 17762 Falling Water Rd
- 17524 Falling Water Rd
- 17465 Falling Water Rd
- 12252 Moss Point Rd
- 17482 Falling Water Rd
- 17429 Falling Water Rd
- 12248 Moss Point Rd
- 17444 Falling Water Rd
- 12287 Moss Ridge Cir
- 17393 Falling Water Rd
- 12283 Moss Ridge Cir
- S/L 129 Falling Water Rd
- 12244 Moss Point Rd
- 17359 Falling Water Rd
- 17797 Falling Water Rd
- 17364 Falling Water Rd