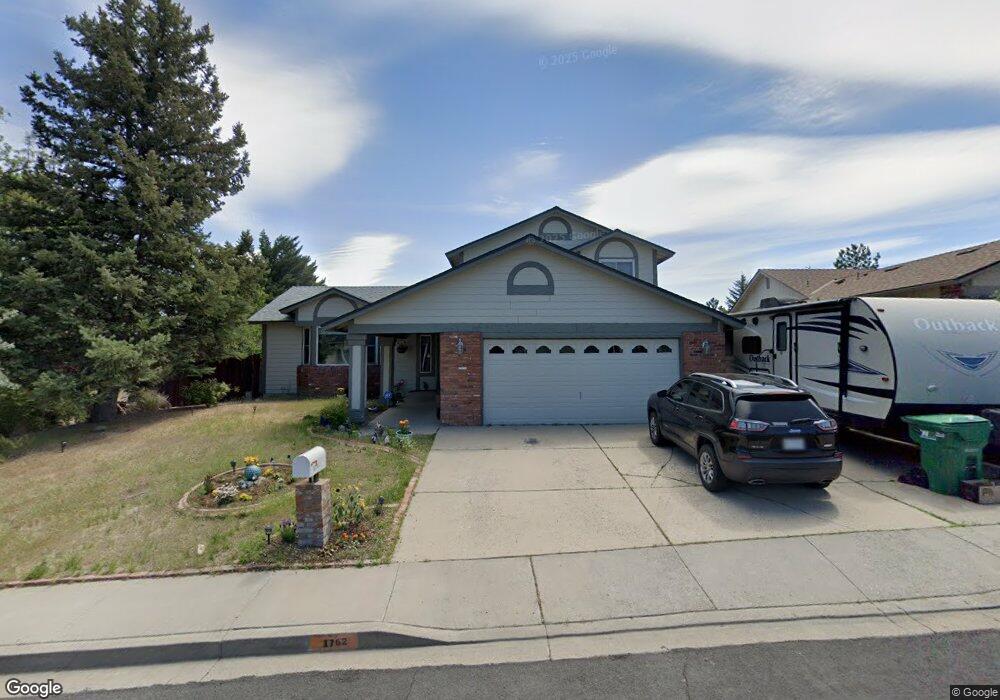
1762 Havencrest Dr Reno, NV 89523
Northgate NeighborhoodEstimated Value: $538,000 - $682,000
4
Beds
3
Baths
2,152
Sq Ft
$291/Sq Ft
Est. Value
About This Home
This home is located at 1762 Havencrest Dr, Reno, NV 89523 and is currently estimated at $625,819, approximately $290 per square foot. 1762 Havencrest Dr is a home located in Washoe County with nearby schools including B D Billinghurst Middle School, Robert McQueen High School, and The King's Academy.
Ownership History
Date
Name
Owned For
Owner Type
Purchase Details
Closed on
Dec 7, 2016
Sold by
Huckaby Timothy C and Leard Gail
Bought by
Huckaby Timothy C
Current Estimated Value
Home Financials for this Owner
Home Financials are based on the most recent Mortgage that was taken out on this home.
Original Mortgage
$244,000
Outstanding Balance
$172,253
Interest Rate
3.47%
Mortgage Type
New Conventional
Estimated Equity
$453,566
Purchase Details
Closed on
Aug 11, 2011
Sold by
Huckaby Gail C
Bought by
Huckaby Timothy C
Purchase Details
Closed on
Jun 26, 2001
Sold by
Hall Harold E and Hall Cheryl A
Bought by
Huckaby Timothy C and Huckaby Gail C
Home Financials for this Owner
Home Financials are based on the most recent Mortgage that was taken out on this home.
Original Mortgage
$179,900
Interest Rate
7.14%
Create a Home Valuation Report for This Property
The Home Valuation Report is an in-depth analysis detailing your home's value as well as a comparison with similar homes in the area
Home Values in the Area
Average Home Value in this Area
Purchase History
| Date | Buyer | Sale Price | Title Company |
|---|---|---|---|
| Huckaby Timothy C | -- | Capital Title Co Of Nevada | |
| Huckaby Timothy C | -- | None Available | |
| Huckaby Timothy C | $200,000 | Founders Title Co |
Source: Public Records
Mortgage History
| Date | Status | Borrower | Loan Amount |
|---|---|---|---|
| Open | Huckaby Timothy C | $244,000 | |
| Closed | Huckaby Timothy C | $179,900 |
Source: Public Records
Tax History
| Year | Tax Paid | Tax Assessment Tax Assessment Total Assessment is a certain percentage of the fair market value that is determined by local assessors to be the total taxable value of land and additions on the property. | Land | Improvement |
|---|---|---|---|---|
| 2026 | $1,798 | $98,088 | $47,250 | $50,838 |
| 2024 | $2,331 | $89,319 | $35,735 | $53,584 |
| 2023 | $2,264 | $90,953 | $39,585 | $51,368 |
| 2022 | $2,198 | $76,868 | $33,565 | $43,303 |
| 2021 | $2,135 | $70,324 | $26,775 | $43,549 |
| 2020 | $2,071 | $70,892 | $26,810 | $44,082 |
| 2019 | $2,013 | $69,928 | $26,810 | $43,118 |
| 2018 | $1,954 | $62,408 | $19,775 | $42,633 |
| 2017 | $1,895 | $61,593 | $18,515 | $43,078 |
| 2016 | $1,827 | $60,114 | $17,605 | $42,509 |
| 2015 | $1,824 | $57,798 | $15,015 | $42,783 |
| 2014 | $1,770 | $54,683 | $12,950 | $41,733 |
| 2013 | -- | $46,878 | $9,695 | $37,183 |
Source: Public Records
Map
Nearby Homes
- 1777 Havencrest Dr
- 6811 Sonterra Ln
- 6790 Sandia Dr
- 1585 Mescalero Ave
- 6052 Bankside Way
- 0 Unit 250003854
- Walker Plan at Monarch
- Humboldt Plan at Monarch
- 5861 Morgan Horse St
- 5857 Morgan Horse St
- 2365 Red Maple Ct
- 1584 Grazer Way
- 1598 Grazer Way
- 1596 Grazer Way
- 5764 Golden Eagle Dr
- 1530 Springfield Park Dr
- 7350 Austin Creek Ct
- 5722 Golden Eagle Dr
- 2130 Canyon Mesa Ct
- 2605 Snow Partridge Dr
- 1772 Havencrest Dr
- 1742 Havencrest Dr
- 1705 Hanover Dr
- 1782 Havencrest Dr
- 1722 Havencrest Dr
- 1767 Havencrest Dr
- 1747 Havencrest Dr
- 6425 Stone Valley Dr
- 1727 Havencrest Dr
- 1715 Hanover Dr
- 1702 Havencrest Dr
- 1701 Hanover Dr
- 6415 Stone Valley Dr
- 1792 Havencrest Dr
- 1787 Havencrest Dr
- 1695 Hanover Dr
- 1707 Havencrest Dr
- 6405 Stone Valley Dr
- 1692 Havencrest Dr
- 1734 Shadow Wood Rd
Your Personal Tour Guide
Ask me questions while you tour the home.