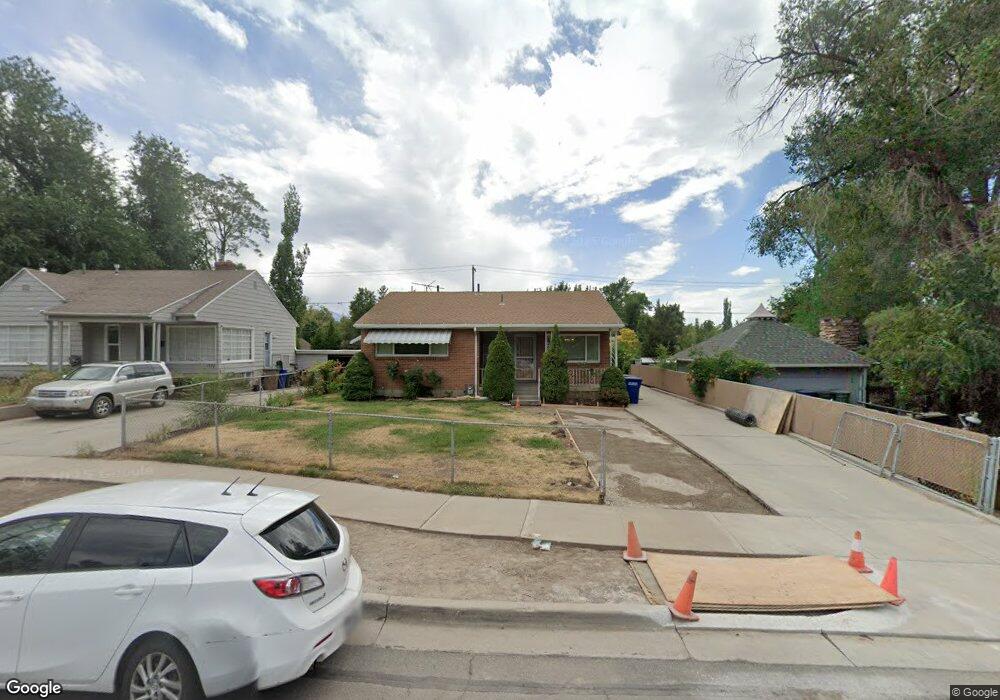
1762 Sunnyside Ave Salt Lake City, UT 84108
Yalecrest NeighborhoodEstimated Value: $821,000 - $1,111,913
4
Beds
6
Baths
1,629
Sq Ft
$566/Sq Ft
Est. Value
About This Home
This home is located at 1762 Sunnyside Ave, Salt Lake City, UT 84108 and is currently estimated at $922,228, approximately $566 per square foot. 1762 Sunnyside Ave is a home located in Salt Lake County with nearby schools including Bonneville School, Clayton Middle School, and East High School.
Ownership History
Date
Name
Owned For
Owner Type
Purchase Details
Closed on
Oct 25, 2024
Sold by
Hagen Scott and Hagen Loree
Bought by
Gritton Keith Andrew and Gritton Andrea
Current Estimated Value
Home Financials for this Owner
Home Financials are based on the most recent Mortgage that was taken out on this home.
Original Mortgage
$592,500
Outstanding Balance
$586,690
Interest Rate
6.2%
Mortgage Type
New Conventional
Estimated Equity
$335,538
Purchase Details
Closed on
Dec 7, 2020
Sold by
Morozin Jo and Estate Of Frank Joseph Morozin
Bought by
Hagen Scott and Hagen Loree
Purchase Details
Closed on
Nov 24, 2015
Sold by
Morozin Frank
Bought by
Morozin Frank J
Purchase Details
Closed on
Nov 13, 2015
Sold by
Morozin Frank
Bought by
Morozin Frank J
Purchase Details
Closed on
Apr 16, 2001
Sold by
Morozin Maria
Bought by
Morpzin Maria
Create a Home Valuation Report for This Property
The Home Valuation Report is an in-depth analysis detailing your home's value as well as a comparison with similar homes in the area
Home Values in the Area
Average Home Value in this Area
Purchase History
| Date | Buyer | Sale Price | Title Company |
|---|---|---|---|
| Gritton Keith Andrew | -- | Cottonwood Title | |
| Hagen Scott | -- | Truly Title Inc | |
| Morozin Frank J | -- | None Available | |
| Morozin Frank J | -- | None Available | |
| Morpzin Maria | -- | -- |
Source: Public Records
Mortgage History
| Date | Status | Borrower | Loan Amount |
|---|---|---|---|
| Open | Gritton Keith Andrew | $592,500 |
Source: Public Records
Tax History Compared to Growth
Tax History
| Year | Tax Paid | Tax Assessment Tax Assessment Total Assessment is a certain percentage of the fair market value that is determined by local assessors to be the total taxable value of land and additions on the property. | Land | Improvement |
|---|---|---|---|---|
| 2025 | $16 | $817,300 | $303,500 | $513,800 |
| 2024 | $16 | $804,800 | $289,600 | $515,200 |
| 2023 | $16 | $773,400 | $278,400 | $495,000 |
| 2022 | $740 | $756,700 | $273,000 | $483,700 |
| 2021 | $3,650 | $570,200 | $222,000 | $348,200 |
| 2020 | $306 | $495,300 | $207,500 | $287,800 |
| 2019 | $3,023 | $423,200 | $197,500 | $225,700 |
| 2018 | $0 | $389,600 | $197,500 | $192,100 |
| 2017 | $2,959 | $379,500 | $197,500 | $182,000 |
| 2016 | $2,959 | $358,700 | $197,500 | $161,200 |
| 2015 | $2,681 | $308,000 | $201,500 | $106,500 |
| 2014 | -- | $282,800 | $193,600 | $89,200 |
Source: Public Records
Map
Nearby Homes
- 1740 E Sunnyside Ave
- 1920 Sunnyside Ave S
- 1639 E 900 S
- 1763 Herbert Ave S
- 847 Greenwood Terrace
- 966 S Diestel Rd
- 980 Diestel Rd
- 1543 E 900 S
- 2034 E Hubbard Ave
- 928 S 1500 E
- 1644 E Princeton Ave
- 1929 Laird Dr
- 2008 E Laird Dr
- 865 S 2200 E
- 1458 Princeton Ave S
- 2259 E Hubbard Ave
- 1232 S 1500 E
- 1170 S Foothill Dr Unit 311
- 1182 S Foothill Dr Unit 511
- 1370 S Filmore St
- 1762 E Sunnyside Ave
- 1772 Sunnyside Ave
- 1772 E Sunnyside Ave
- 1778 Sunnyside Ave
- 1778 E Sunnyside Ave
- 1778 E Sunnyside Ave Unit 6
- 1756 Sunnyside Ave
- 1791 E 900 S
- 1797 E 900 S
- 1781 E 900 S
- 1801 E 900 S
- 1777 E 900 S
- 852 Le Grand St
- 1811 E 900 S
- 1771 E 900 S
- 1815 E 900 S
- 1763 E 900 S
- 859 S Le Grand St Unit 859
- 1757 E 900 S
- 875 Le Grand St