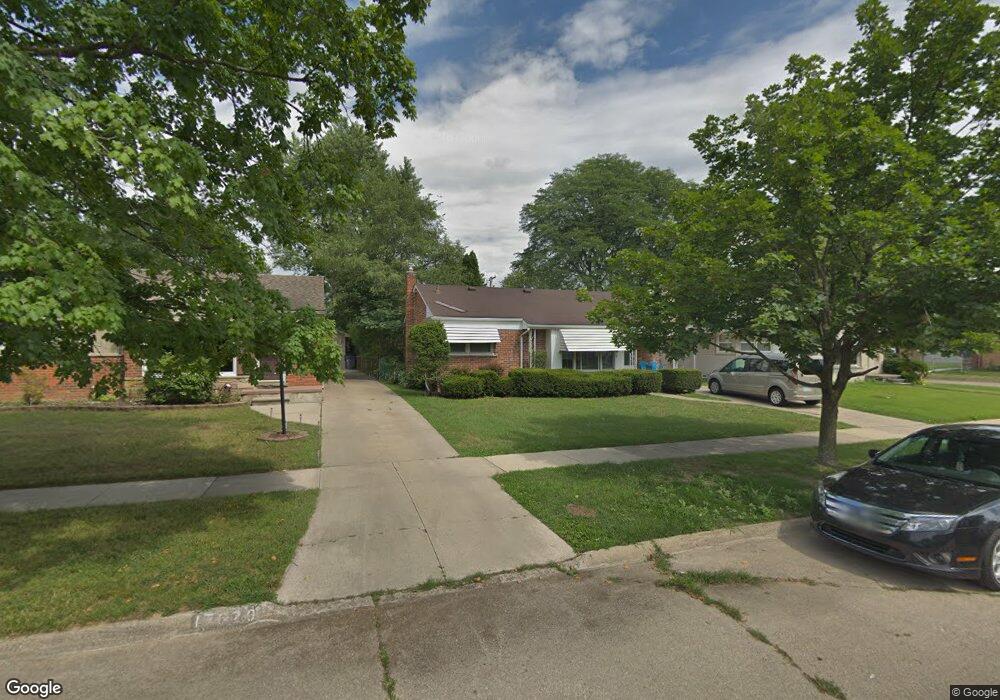
17620 Denby Unit Bldg-Unit Redford, MI 48240
Estimated Value: $210,701 - $292,000
--
Bed
2
Baths
1,181
Sq Ft
$205/Sq Ft
Est. Value
About This Home
This home is located at 17620 Denby Unit Bldg-Unit, Redford, MI 48240 and is currently estimated at $242,425, approximately $205 per square foot. 17620 Denby Unit Bldg-Unit is a home located in Wayne County with nearby schools including Beech Elementary School, Hilbert Middle School, and Redford Union High School.
Ownership History
Date
Name
Owned For
Owner Type
Purchase Details
Closed on
Feb 28, 2018
Sold by
Redford West Llc
Bought by
Hall Demetrius
Current Estimated Value
Purchase Details
Closed on
Nov 23, 2016
Sold by
Garcia Luis and Garcia Sunshine
Bought by
Redford West Llc
Purchase Details
Closed on
Oct 27, 2016
Sold by
Garcia Whereas Sunshine and Garcia Luis
Bought by
Fedford West Llc
Purchase Details
Closed on
Apr 3, 1998
Sold by
Gerat David W and Gerat Sandra L
Bought by
Hammonds Luis Garcia Sunshine
Create a Home Valuation Report for This Property
The Home Valuation Report is an in-depth analysis detailing your home's value as well as a comparison with similar homes in the area
Home Values in the Area
Average Home Value in this Area
Purchase History
| Date | Buyer | Sale Price | Title Company |
|---|---|---|---|
| Hall Demetrius | $130,000 | Reputation First Title Agenc | |
| Redford West Llc | $3,000 | None Available | |
| Fedford West Llc | $44,001 | None Available | |
| Hammonds Luis Garcia Sunshine | $89,900 | -- |
Source: Public Records
Tax History Compared to Growth
Tax History
| Year | Tax Paid | Tax Assessment Tax Assessment Total Assessment is a certain percentage of the fair market value that is determined by local assessors to be the total taxable value of land and additions on the property. | Land | Improvement |
|---|---|---|---|---|
| 2025 | $1,441 | $96,500 | $0 | $0 |
| 2024 | $1,441 | $87,900 | $0 | $0 |
| 2023 | $1,375 | $75,200 | $0 | $0 |
| 2022 | $3,277 | $65,600 | $0 | $0 |
| 2021 | $3,186 | $62,200 | $0 | $0 |
| 2020 | $3,141 | $56,900 | $0 | $0 |
| 2019 | $3,071 | $47,100 | $0 | $0 |
| 2018 | $1,023 | $39,400 | $0 | $0 |
| 2017 | $2,869 | $36,800 | $0 | $0 |
| 2016 | $1,916 | $34,400 | $0 | $0 |
| 2015 | $2,845 | $31,000 | $0 | $0 |
| 2013 | $2,850 | $29,000 | $0 | $0 |
| 2012 | $2,142 | $33,600 | $7,800 | $25,800 |
Source: Public Records
Map
Nearby Homes