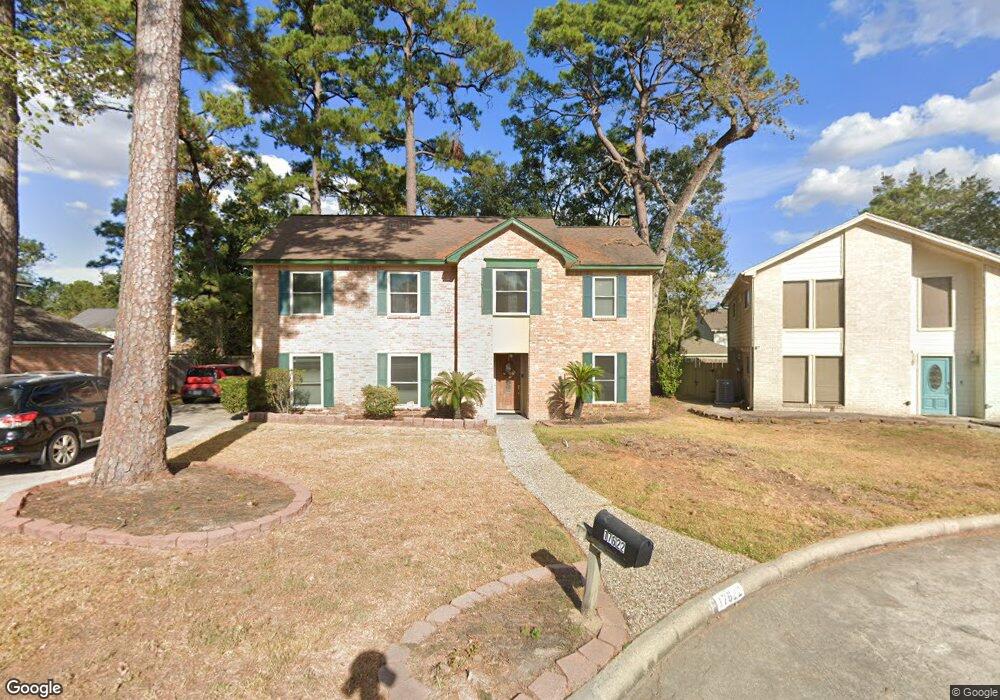
17622 Mantana Ct Spring, TX 77388
Champions NeighborhoodEstimated Value: $291,550 - $314,000
4
Beds
3
Baths
2,384
Sq Ft
$127/Sq Ft
Est. Value
About This Home
This home is located at 17622 Mantana Ct, Spring, TX 77388 and is currently estimated at $303,388, approximately $127 per square foot. 17622 Mantana Ct is a home located in Harris County with nearby schools including Haude Elementary School, Strack Intermediate School, and Klein Collins High School.
Ownership History
Date
Name
Owned For
Owner Type
Purchase Details
Closed on
May 11, 2024
Sold by
Ross Ronald
Bought by
Ross Nakeeva
Current Estimated Value
Home Financials for this Owner
Home Financials are based on the most recent Mortgage that was taken out on this home.
Original Mortgage
$14,777
Outstanding Balance
$14,474
Interest Rate
6.82%
Mortgage Type
New Conventional
Estimated Equity
$288,914
Purchase Details
Closed on
Oct 17, 2019
Sold by
Latawiec Edward A and Latawiec Anita M
Bought by
Ross Ronald
Home Financials for this Owner
Home Financials are based on the most recent Mortgage that was taken out on this home.
Original Mortgage
$205,214
Interest Rate
3.62%
Mortgage Type
FHA
Purchase Details
Closed on
Sep 2, 1998
Sold by
Martin Phillip E and Martin Martha Jeanne
Bought by
Latawiec Edward A and Latawiec Anita M
Home Financials for this Owner
Home Financials are based on the most recent Mortgage that was taken out on this home.
Original Mortgage
$89,520
Interest Rate
6.93%
Create a Home Valuation Report for This Property
The Home Valuation Report is an in-depth analysis detailing your home's value as well as a comparison with similar homes in the area
Home Values in the Area
Average Home Value in this Area
Purchase History
| Date | Buyer | Sale Price | Title Company |
|---|---|---|---|
| Ross Nakeeva | -- | None Listed On Document | |
| Ross Ronald | -- | Capital Title | |
| Latawiec Edward A | -- | Alamo Title 40 |
Source: Public Records
Mortgage History
| Date | Status | Borrower | Loan Amount |
|---|---|---|---|
| Open | Ross Nakeeva | $14,777 | |
| Previous Owner | Ross Ronald | $205,214 | |
| Previous Owner | Latawiec Edward A | $89,520 |
Source: Public Records
Tax History Compared to Growth
Tax History
| Year | Tax Paid | Tax Assessment Tax Assessment Total Assessment is a certain percentage of the fair market value that is determined by local assessors to be the total taxable value of land and additions on the property. | Land | Improvement |
|---|---|---|---|---|
| 2025 | $5,863 | $279,107 | $58,394 | $220,713 |
| 2024 | $5,863 | $269,004 | $58,394 | $210,610 |
| 2023 | $5,863 | $288,450 | $58,394 | $230,056 |
| 2022 | $4,066 | $252,556 | $58,394 | $194,162 |
| 2021 | $4,773 | $193,669 | $32,117 | $161,552 |
| 2020 | $5,282 | $205,602 | $32,117 | $173,485 |
| 2019 | $5,295 | $205,602 | $32,117 | $173,485 |
| 2018 | $2,222 | $180,352 | $32,117 | $148,235 |
| 2017 | $4,821 | $180,352 | $32,117 | $148,235 |
| 2016 | $4,719 | $180,352 | $32,117 | $148,235 |
| 2015 | $3,448 | $174,812 | $32,117 | $142,695 |
| 2014 | $3,448 | $145,905 | $29,197 | $116,708 |
Source: Public Records
Map
Nearby Homes
- 3826 Cypress Hill Dr
- 3623 Beech Hill Dr
- 3923 Cypress Lake Dr
- 3610 Blue Cypress Dr
- 17722 Sorrel Ridge Dr
- 17623 Bent Cypress Dr
- 3930 Cypress Hill Dr
- 4034 Oxhill Rd
- 17618 Tall Cypress Dr
- 3614 Shipman Ln
- 18318 Ella Blvd
- 3503 Arbor Terrace Ct
- 3639 Fir Forest Dr
- 4126 Oxhill Rd
- 17910 Loring Ln
- 3518 Cypresswood Dr
- 3518 Blue Cypress Dr
- 3515 Blue Cypress Dr
- 4019 Fir Forest Dr
- 17926 Cypress Spring Dr
- 17626 Mantana Ct
- 17618 Mantana Ct
- 3714 Cypress Hill Dr
- 3710 Cypress Hill Dr
- 3718 Cypress Hill Dr
- 17630 Mantana Ct
- 17614 Mantana Ct
- 17607 Mantana Ct
- 3706 Cypress Hill Dr
- 3722 Cypress Hill Dr
- 17610 Mantana Ct
- 17634 Mantana Ct
- 17606 Mantana Ct
- 3726 Cypress Hill Dr
- 3803 Cypresswood Dr
- 17414 Cassina Dr
- 17418 Cassina Dr
- 3715 Cypress Hill Dr
- 3711 Cypress Hill Dr
- 17410 Cassina Dr