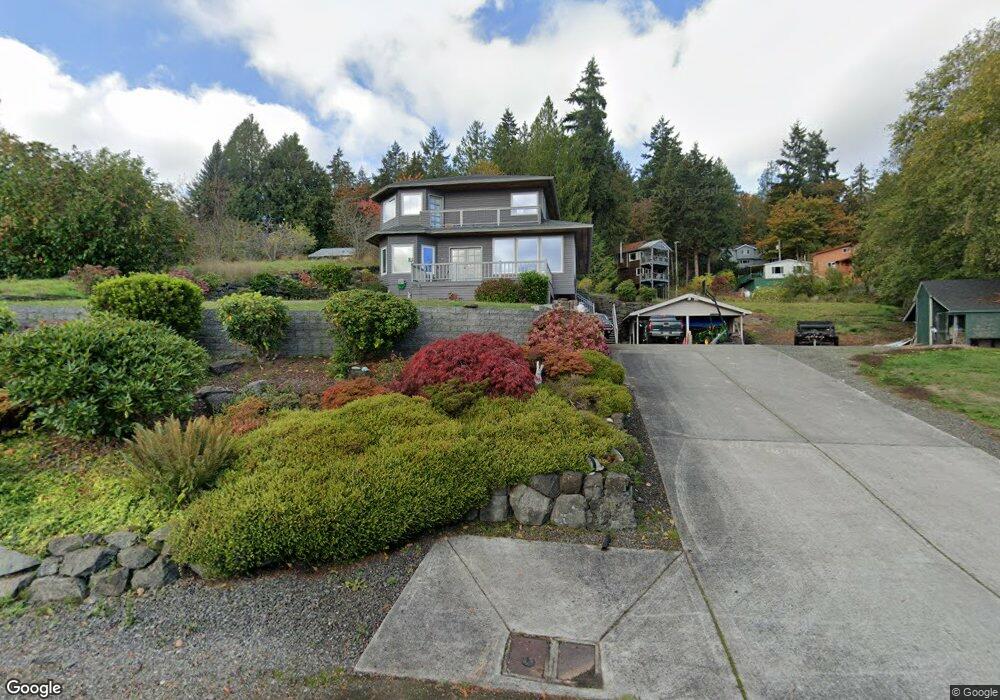
17627 Angeline Avenue South NE Suquamish, WA 98392
Suquamish NeighborhoodEstimated Value: $1,124,988 - $1,675,000
4
Beds
3
Baths
3,695
Sq Ft
$381/Sq Ft
Est. Value
About This Home
This home is located at 17627 Angeline Avenue South NE, Suquamish, WA 98392 and is currently estimated at $1,409,497, approximately $381 per square foot. 17627 Angeline Avenue South NE is a home located in Kitsap County with nearby schools including Suquamish Elementary School, Kingston Middle School, and Kingston High School.
Ownership History
Date
Name
Owned For
Owner Type
Purchase Details
Closed on
Aug 18, 2020
Sold by
Stuart Tiffany and 17627 S Angeline Ave Ne Trust
Bought by
Korsak Paul V and Korsak Rebecca J
Current Estimated Value
Purchase Details
Closed on
Oct 2, 2019
Sold by
Korsak Paul V and Korsak Rebecca J
Bought by
Stuart Tiffany and 17627 S Angeline Ave N E Trust
Purchase Details
Closed on
Jun 3, 1999
Sold by
Korsak Paul V and Korsak Rebecca J
Bought by
Korsak Paul V and Korsak Rebecca J
Home Financials for this Owner
Home Financials are based on the most recent Mortgage that was taken out on this home.
Original Mortgage
$137,000
Interest Rate
6.9%
Create a Home Valuation Report for This Property
The Home Valuation Report is an in-depth analysis detailing your home's value as well as a comparison with similar homes in the area
Home Values in the Area
Average Home Value in this Area
Purchase History
| Date | Buyer | Sale Price | Title Company |
|---|---|---|---|
| Korsak Paul V | -- | None Available | |
| Stuart Tiffany | -- | None Available | |
| Korsak Paul V | -- | Pacific Nw Title |
Source: Public Records
Mortgage History
| Date | Status | Borrower | Loan Amount |
|---|---|---|---|
| Previous Owner | Korsak Paul V | $137,000 |
Source: Public Records
Tax History Compared to Growth
Tax History
| Year | Tax Paid | Tax Assessment Tax Assessment Total Assessment is a certain percentage of the fair market value that is determined by local assessors to be the total taxable value of land and additions on the property. | Land | Improvement |
|---|---|---|---|---|
| 2026 | $1,595 | $1,092,530 | $164,930 | $927,600 |
| 2025 | $1,595 | $1,092,530 | $164,930 | $927,600 |
| 2024 | $1,529 | $1,038,300 | $151,160 | $887,140 |
| 2023 | $1,560 | $1,038,300 | $151,160 | $887,140 |
| 2022 | $1,573 | $815,960 | $125,960 | $690,000 |
| 2021 | $7,043 | $704,230 | $108,520 | $595,710 |
| 2020 | $6,821 | $673,680 | $103,680 | $570,000 |
| 2019 | $6,407 | $632,600 | $96,890 | $535,710 |
| 2018 | $5,970 | $488,080 | $80,750 | $407,330 |
| 2017 | $5,652 | $488,080 | $80,750 | $407,330 |
| 2016 | $5,359 | $423,790 | $80,750 | $343,040 |
| 2015 | $5,323 | $423,790 | $80,750 | $343,040 |
| 2014 | -- | $404,910 | $80,750 | $324,160 |
| 2013 | -- | $404,910 | $80,750 | $324,160 |
Source: Public Records
Map
Nearby Homes
- 17880 Purves Ave NE
- 17655 Division Ave NE
- 17691 Division Ave NE
- 17274 Angeline Ave NE
- 6341 NE Balzow Rd
- 18610 5th Ave NE
- 17711 Division Ave NE
- 6712 NE Geneva St
- 18689 1st Ave NE
- 18952 Brockton Ave NE
- 0 20+ac Sackman Ln NE
- 6615 NE Maple St
- 18971 Soundview Blvd NE
- 5450 NE Laura Loop
- 19313 Harris Ave NE
- 18872 Augusta Ave NE
- 6705 NE Prospect St
- 16790 Agate Point Rd NE
- 0 Augusta Ave NE Unit NWM2412417
- 15630 Agatewood Rd NE
- 0 Lot 16 S Angeline Ave
- 17 S Angeline Ave NE
- 17620 Division Ave NE
- 17634 Division Ave NE
- 17632 Angeline Avenue South NE
- 17661 S Angeline Ave NE
- 17561 S Angeline Ave NE
- 17662 Division Ave NE
- 6422 NE Jones St
- 17650 Division Ave NE
- 17662 S Angeline Ave NE
- 17610 Division Ave NE
- 17622 Angeline Avenue South NE
- 17568 S Angeline Ave NE
- 17562 Angeline Avenue South NE
- 17670 Division Ave NE
- 17673 S Angeline Ave NE
- 17600 Division Ave NE
- 17688 Division Ave NE
- 6346 NE Suquamish Way