1763 Cedar Ridge Way Branson West, MO 65737
Estimated Value: $352,000 - $442,107
3
Beds
3
Baths
2,836
Sq Ft
$139/Sq Ft
Est. Value
About This Home
This home is located at 1763 Cedar Ridge Way, Branson West, MO 65737 and is currently estimated at $394,277, approximately $139 per square foot. 1763 Cedar Ridge Way is a home located in Stone County with nearby schools including Reeds Spring Primary School, Reeds Spring Elementary School, and Reeds Spring Middle School.
Ownership History
Date
Name
Owned For
Owner Type
Purchase Details
Closed on
Jul 1, 2021
Sold by
Brunner Dennis R and Brunner Susan M
Bought by
Brunner Dennis R and Brunner Susan M
Current Estimated Value
Purchase Details
Closed on
Jun 28, 2021
Sold by
Galyon Robert N and Galyon Tracy A
Bought by
Brunner Dennis R and Brunner Susan M
Purchase Details
Closed on
Feb 6, 2017
Sold by
Galyon Robert N and Galyon Tracy A
Bought by
Galyon Robert N and Galyon Tracy A
Purchase Details
Closed on
Dec 2, 2015
Sold by
Gaylon Robert N and Gaylon Tracy A
Bought by
Gaylon Robert N and Gaylon Tracy A
Purchase Details
Closed on
Apr 18, 2014
Sold by
Warner Randall Allen
Bought by
Galyon Robert and Galyon Tracy A
Home Financials for this Owner
Home Financials are based on the most recent Mortgage that was taken out on this home.
Original Mortgage
$142,400
Interest Rate
4.34%
Mortgage Type
New Conventional
Create a Home Valuation Report for This Property
The Home Valuation Report is an in-depth analysis detailing your home's value as well as a comparison with similar homes in the area
Home Values in the Area
Average Home Value in this Area
Purchase History
| Date | Buyer | Sale Price | Title Company |
|---|---|---|---|
| Brunner Dennis R | -- | None Available | |
| Brunner Dennis R | -- | None Available | |
| Galyon Robert N | -- | None Available | |
| Gaylon Robert N | -- | None Available | |
| Galyon Robert | -- | Hogan Land Title |
Source: Public Records
Mortgage History
| Date | Status | Borrower | Loan Amount |
|---|---|---|---|
| Previous Owner | Galyon Robert | $142,400 |
Source: Public Records
Tax History Compared to Growth
Tax History
| Year | Tax Paid | Tax Assessment Tax Assessment Total Assessment is a certain percentage of the fair market value that is determined by local assessors to be the total taxable value of land and additions on the property. | Land | Improvement |
|---|---|---|---|---|
| 2024 | $1,670 | $34,140 | -- | -- |
| 2023 | $1,670 | $34,140 | $0 | $0 |
| 2022 | $1,661 | $34,140 | $0 | $0 |
| 2021 | $1,681 | $34,140 | $0 | $0 |
| 2020 | $1,481 | $34,140 | $0 | $0 |
| 2019 | $1,472 | $34,140 | $0 | $0 |
| 2018 | $1,470 | $34,140 | $0 | $0 |
| 2017 | $1,472 | $34,140 | $0 | $0 |
| 2016 | $1,432 | $34,140 | $0 | $0 |
| 2015 | $1,434 | $34,140 | $0 | $0 |
| 2014 | $1,412 | $34,140 | $0 | $0 |
| 2012 | $2,064 | $34,140 | $0 | $0 |
Source: Public Records
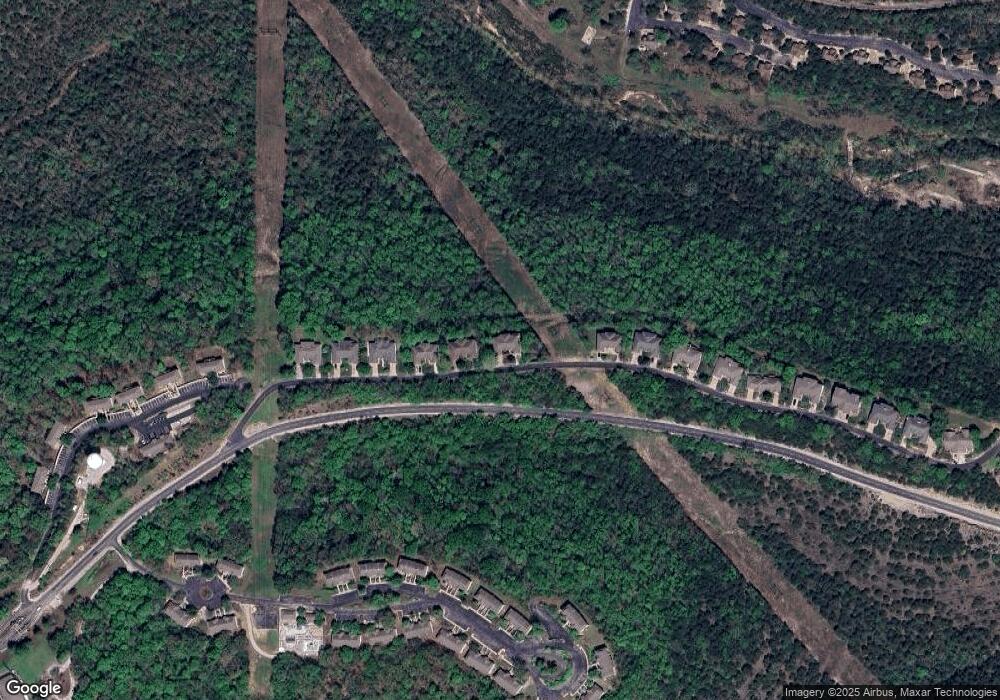
Map
Nearby Homes
- 1761 Cedar Ridge Way
- 1745 Cedar Ridge Way
- 41 Stepping Stone Way Unit 55
- 144 Oak Ln Unit 144
- 000 Baldknobber -1 25+ - Acres Dr
- 1704 Cedar Ridge Way
- 880 Black Forest Ln
- 527 Notch Ln Unit 10
- 499 Notch Ln Unit 3
- 550 Notch Ln Unit 2
- 550 Notch Ln Unit 1
- 526 Notch Ln Unit 10
- 437 Notch Ln Unit 9
- 437 Notch Ln Unit 8
- 000 Beechwood Dr
- 380 Beechwood Dr
- 321 Notch Ln Unit 9
- 388 Notch Ln Unit 11
- 388 Notch Ln
- 388 Notch Ln Unit 12
- 1767 Cedar Ridge Way
- 1769 Cedar Ridge Way
- 1759 Cedar Ridge Way
- 1773 Cedar Ridge Way
- 1757 Cedar Ridge Way
- 1755 Cedar Ridge Way
- 1777 Cedar Ridge Way
- 1753 Cedar Ridge Way
- 1779 Cedar Ridge Way
- 1751 Cedar Ridge Way
- 1747 Cedar Ridge Way
- 0 Cedar Ridge Way
- 1743 Cedar Ridge Way
- 1741 Cedar Ridge Way
- 173 Oak Ln Unit 173
- 1739 Cedar Ridge Way
- 1737 Cedar Ridge Way
- 29 Baldknobber Dr
- 31 Baldknobber Drive (Reo)
- 164 Oak Ln