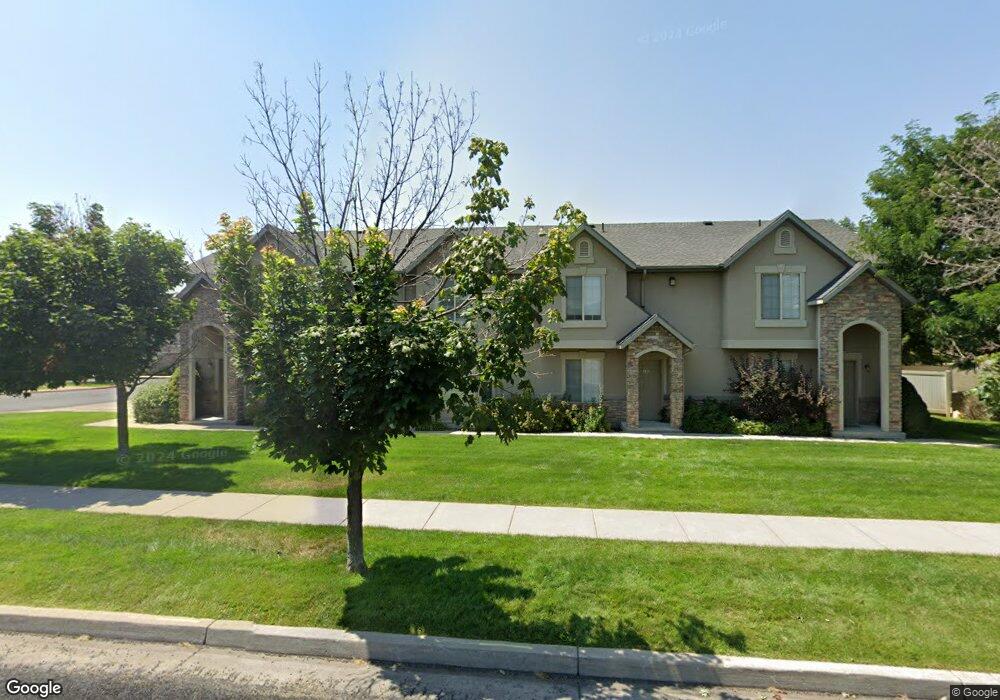
1763 N 425 W Unit 104-9 Logan, UT 84341
Bridger NeighborhoodEstimated Value: $265,000 - $289,000
2
Beds
2
Baths
1,099
Sq Ft
$255/Sq Ft
Est. Value
About This Home
This home is located at 1763 N 425 W Unit 104-9, Logan, UT 84341 and is currently estimated at $280,246, approximately $255 per square foot. 1763 N 425 W Unit 104-9 is a home located in Cache County with nearby schools including Bridger School, Mount Logan Middle School, and Logan High School.
Ownership History
Date
Name
Owned For
Owner Type
Purchase Details
Closed on
Feb 14, 2022
Sold by
B9-104 Logan Llc
Bought by
Casperson Quentin R and Casperson Dianne B
Current Estimated Value
Home Financials for this Owner
Home Financials are based on the most recent Mortgage that was taken out on this home.
Original Mortgage
$50,000
Outstanding Balance
$46,251
Interest Rate
3.55%
Mortgage Type
Credit Line Revolving
Estimated Equity
$233,995
Purchase Details
Closed on
Feb 24, 2014
Sold by
Peterson Scott D
Bought by
B9 & 104 Logan Llc
Purchase Details
Closed on
Jan 31, 2012
Sold by
B9 & 104 Logan Llc
Bought by
Peterson Scott D
Purchase Details
Closed on
Dec 22, 2009
Sold by
Castle Mountain Properties Llc
Bought by
B9 & 104 Logan Llc
Create a Home Valuation Report for This Property
The Home Valuation Report is an in-depth analysis detailing your home's value as well as a comparison with similar homes in the area
Home Values in the Area
Average Home Value in this Area
Purchase History
| Date | Buyer | Sale Price | Title Company |
|---|---|---|---|
| Casperson Quentin R | -- | Stewart Title | |
| B9 & 104 Logan Llc | -- | Hickman Land Title Company | |
| Peterson Scott D | -- | Wasatch Land & Title | |
| B9 & 104 Logan Llc | -- | None Available |
Source: Public Records
Mortgage History
| Date | Status | Borrower | Loan Amount |
|---|---|---|---|
| Open | Casperson Quentin R | $50,000 |
Source: Public Records
Tax History Compared to Growth
Tax History
| Year | Tax Paid | Tax Assessment Tax Assessment Total Assessment is a certain percentage of the fair market value that is determined by local assessors to be the total taxable value of land and additions on the property. | Land | Improvement |
|---|---|---|---|---|
| 2025 | $1,225 | $158,375 | $0 | $0 |
| 2024 | $130 | $163,410 | $0 | $0 |
| 2023 | $1,359 | $162,250 | $0 | $0 |
| 2022 | $1,480 | $165,000 | $0 | $0 |
| 2021 | $1,140 | $196,450 | $40,000 | $156,450 |
| 2020 | $1,049 | $162,579 | $40,000 | $122,579 |
| 2019 | $1,096 | $162,578 | $40,000 | $122,578 |
| 2018 | $972 | $131,590 | $25,000 | $106,590 |
| 2017 | $936 | $67,045 | $0 | $0 |
| 2016 | $971 | $54,450 | $0 | $0 |
| 2015 | $772 | $53,240 | $0 | $0 |
| 2014 | $698 | $53,240 | $0 | $0 |
| 2013 | -- | $53,130 | $0 | $0 |
Source: Public Records
Map
Nearby Homes
- 1762 N 460 W Unit 103-10
- 2 Somerset Place
- 1926 Lavender Loop Unit 6
- 259 W 1800 N
- 446 W 1595 N Unit 103
- 60 Hampton Place
- 1584 N 565 W Unit 104
- 1565 N 565 W Unit 101
- 1515 N 450 W Unit 103
- 514 W 1490 N Unit 102
- 1492 N 565 W Unit 101
- 539 W 1465 N Unit 17-102
- Park Avenue 1600 Plan at Park Avenue 1600
- 490 W 1950 N Unit 27
- 559 W 1350 N Unit 41
- 432 Spring Ln
- 2200 N 220 W
- 251 E 1630 N Unit 4
- 239 E 1530 N
- 272 E 1725 N Unit 3
- 1763 N 425 W Unit 101-9
- 438 W 1800 N Unit 101-6
- 438 W 1800 N Unit 103-6
- 450 W 1800 N
- 450 W 1800 N Unit 103-5
- 450 W 1800 N Unit 101-5
- 450 W 1800 N Unit 103
- 1873 N 460 W
- 1759 N 425 W Unit 101
- 1759 N 425 W
- 1759 N 425 W Unit 104-12
- 470 W 1800 N
- 470 W 1800 N Unit 104-4
- 470 W 1800 N Unit 102
- 1832 N 460 W Unit 30
- 1861 N 460 W Unit 40
- 9 N 460 W Unit 69
- 1 Somerset Place
- 1809 N 400 W
- 1809 N 400 W Unit 22