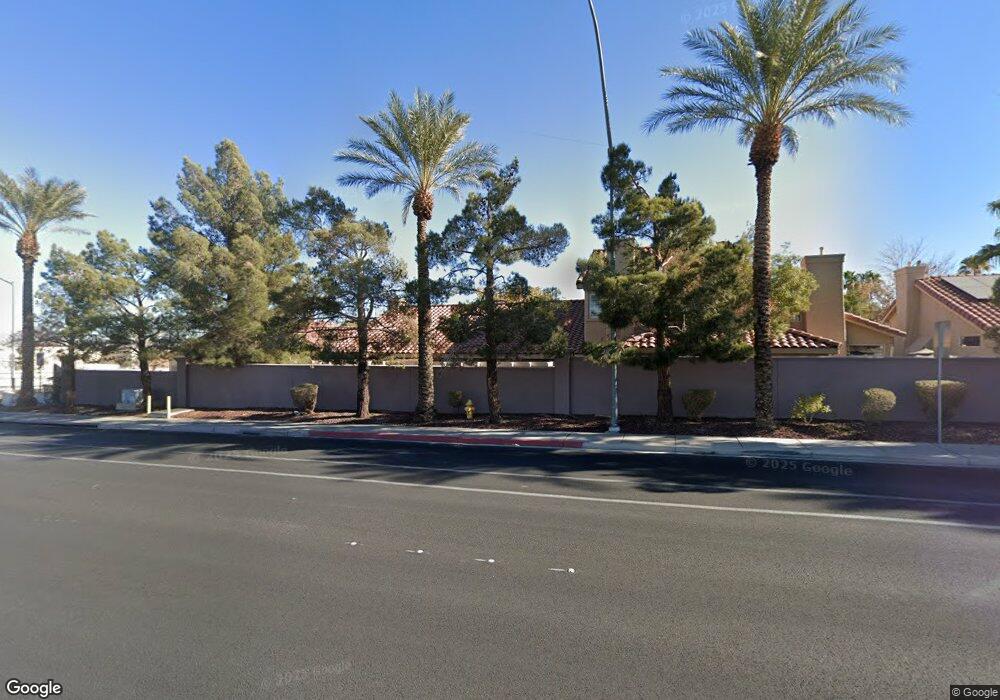
1763 Tanner Cir Henderson, NV 89012
Green Valley Ranch NeighborhoodEstimated Value: $375,664 - $430,000
3
Beds
2
Baths
1,489
Sq Ft
$264/Sq Ft
Est. Value
About This Home
This home is located at 1763 Tanner Cir, Henderson, NV 89012 and is currently estimated at $392,416, approximately $263 per square foot. 1763 Tanner Cir is a home located in Clark County with nearby schools including John Vanderburg Elementary School, Neil C. Twitchell Elementary School, and Bob Miller Middle School.
Ownership History
Date
Name
Owned For
Owner Type
Purchase Details
Closed on
Apr 13, 2012
Sold by
Grubaugh Barbara Irene and Grubaugh Barbara S
Bought by
Grubaugh Barbara Irene and Reid Anna Katheryn
Current Estimated Value
Purchase Details
Closed on
Sep 12, 2002
Sold by
Ames John P and Ames Linda M
Bought by
Grubaugh Barbara S
Home Financials for this Owner
Home Financials are based on the most recent Mortgage that was taken out on this home.
Original Mortgage
$127,400
Outstanding Balance
$53,219
Interest Rate
6.24%
Estimated Equity
$339,197
Purchase Details
Closed on
Sep 29, 1997
Sold by
Monument Points Ltd
Bought by
Ames John P and Ames Linda H
Home Financials for this Owner
Home Financials are based on the most recent Mortgage that was taken out on this home.
Original Mortgage
$126,500
Interest Rate
7.49%
Create a Home Valuation Report for This Property
The Home Valuation Report is an in-depth analysis detailing your home's value as well as a comparison with similar homes in the area
Home Values in the Area
Average Home Value in this Area
Purchase History
| Date | Buyer | Sale Price | Title Company |
|---|---|---|---|
| Grubaugh Barbara Irene | -- | None Available | |
| Grubaugh Barbara S | $168,000 | United Title | |
| Ames John P | $141,000 | First American Title Co |
Source: Public Records
Mortgage History
| Date | Status | Borrower | Loan Amount |
|---|---|---|---|
| Open | Grubaugh Barbara S | $127,400 | |
| Previous Owner | Ames John P | $126,500 |
Source: Public Records
Tax History Compared to Growth
Tax History
| Year | Tax Paid | Tax Assessment Tax Assessment Total Assessment is a certain percentage of the fair market value that is determined by local assessors to be the total taxable value of land and additions on the property. | Land | Improvement |
|---|---|---|---|---|
| 2025 | $1,642 | $90,896 | $37,800 | $53,096 |
| 2024 | $1,595 | $90,896 | $37,800 | $53,096 |
| 2023 | $1,595 | $81,349 | $32,550 | $48,799 |
| 2022 | $1,548 | $72,711 | $26,250 | $46,461 |
| 2021 | $1,503 | $63,965 | $25,900 | $38,065 |
| 2020 | $1,457 | $64,327 | $24,500 | $39,827 |
| 2019 | $1,439 | $59,942 | $20,300 | $39,642 |
| 2018 | $1,373 | $55,558 | $17,500 | $38,058 |
| 2017 | $1,591 | $54,601 | $16,800 | $37,801 |
| 2016 | $1,286 | $47,389 | $8,750 | $38,639 |
| 2015 | $1,283 | $46,708 | $8,750 | $37,958 |
| 2014 | $1,245 | $43,308 | $9,450 | $33,858 |
Source: Public Records
Map
Nearby Homes
- 1746 Tanner Cir
- 1785 Lily Pond Cir
- 1773 Lily Pond Cir
- 1747 Franklin Chase Terrace
- 195 Mountainside Dr
- 17 Sandwedge Dr
- 47 Trailside Ct
- 211 Misty Garden St
- 69 Graythorn Mountain Ct
- 54 Ancient Hills Ln
- 75 Graythorn Mountain Ct
- 1861 Windward Ct
- 75 N Valle Verde Dr Unit 823
- 75 N Valle Verde Dr Unit 524
- 75 N Valle Verde Dr Unit 1822
- 75 N Valle Verde Dr Unit 2121
- 75 N Valle Verde Dr Unit 225
- 75 N Valle Verde Dr Unit 211
- 75 N Valle Verde Dr Unit 621
- 229 Misty Garden St
- 1761 Tanner Cir
- 1765 Tanner Cir
- 1767 Tanner Cir
- 1759 Tanner Cir
- 1762 Tanner Cir
- 1769 Tanner Cir
- 1760 Tanner Cir
- 1757 Tanner Cir
- 1758 Tanner Cir
- 1771 Tanner Cir
- 1755 Tanner Cir
- 1780 Tanner Cir
- 1756 Tanner Cir
- 1782 Tanner Cir
- 1773 Tanner Cir
- 1784 Tanner Cir
- 1754 Tanner Cir
- 1753 Tanner Cir
- 1786 Tanner Cir
- 1775 Tanner Cir