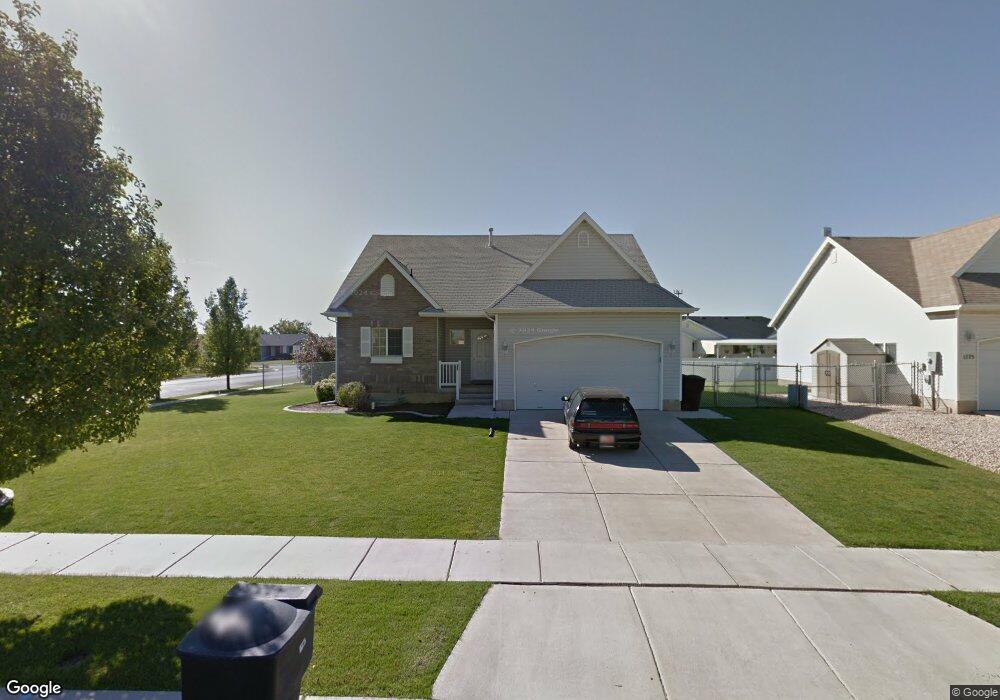
1763 W 1375 S Syracuse, UT 84075
Estimated Value: $440,000 - $477,000
2
Beds
2
Baths
2,330
Sq Ft
$198/Sq Ft
Est. Value
About This Home
This home is located at 1763 W 1375 S, Syracuse, UT 84075 and is currently estimated at $460,490, approximately $197 per square foot. 1763 W 1375 S is a home located in Davis County with nearby schools including Syracuse Elementary School, Syracuse Junior High School, and Syracuse High School.
Ownership History
Date
Name
Owned For
Owner Type
Purchase Details
Closed on
Aug 27, 2019
Sold by
Nevarez Christopher L
Bought by
Nevarez Christopher L and Christopher L Nevarez Trust
Current Estimated Value
Purchase Details
Closed on
Apr 29, 2010
Sold by
Milovich Monica Lyn and Milovich Michael S
Bought by
Nevarez Christopher L
Home Financials for this Owner
Home Financials are based on the most recent Mortgage that was taken out on this home.
Original Mortgage
$7,000
Outstanding Balance
$4,671
Interest Rate
5.04%
Mortgage Type
Stand Alone Second
Estimated Equity
$455,819
Purchase Details
Closed on
Aug 6, 2008
Sold by
Milovich Monica Lyn
Bought by
Milovich Monica Lyn and Milovich Michael S
Purchase Details
Closed on
Nov 1, 2001
Sold by
Benchmark Real Estate Company
Bought by
Milovich Monica Lyn
Home Financials for this Owner
Home Financials are based on the most recent Mortgage that was taken out on this home.
Original Mortgage
$129,920
Interest Rate
6.84%
Mortgage Type
FHA
Create a Home Valuation Report for This Property
The Home Valuation Report is an in-depth analysis detailing your home's value as well as a comparison with similar homes in the area
Home Values in the Area
Average Home Value in this Area
Purchase History
| Date | Buyer | Sale Price | Title Company |
|---|---|---|---|
| Nevarez Christopher L | -- | None Available | |
| Nevarez Christopher L | -- | Highland Title Agency Inc | |
| Milovich Monica Lyn | -- | Highland Title Agency Inc | |
| Milovich Monica Lyn | -- | Founders Title Co |
Source: Public Records
Mortgage History
| Date | Status | Borrower | Loan Amount |
|---|---|---|---|
| Open | Nevarez Christopher L | $7,000 | |
| Open | Nevarez Christopher L | $173,068 | |
| Previous Owner | Milovich Monica Lyn | $129,920 |
Source: Public Records
Tax History Compared to Growth
Tax History
| Year | Tax Paid | Tax Assessment Tax Assessment Total Assessment is a certain percentage of the fair market value that is determined by local assessors to be the total taxable value of land and additions on the property. | Land | Improvement |
|---|---|---|---|---|
| 2025 | $2,400 | $231,550 | $115,454 | $116,096 |
| 2024 | $2,293 | $222,750 | $92,476 | $130,274 |
| 2023 | $2,141 | $379,000 | $129,024 | $249,976 |
| 2022 | $2,318 | $224,950 | $74,680 | $150,270 |
| 2021 | $2,064 | $310,000 | $110,022 | $199,978 |
| 2020 | $1,932 | $281,000 | $97,347 | $183,653 |
| 2019 | $1,860 | $267,000 | $93,314 | $173,686 |
| 2018 | $1,712 | $244,000 | $91,105 | $152,895 |
| 2016 | $1,473 | $110,055 | $35,036 | $75,019 |
| 2015 | $1,423 | $101,255 | $35,036 | $66,219 |
| 2014 | $1,370 | $99,331 | $35,036 | $64,295 |
| 2013 | -- | $109,915 | $32,054 | $77,861 |
Source: Public Records
Map
Nearby Homes
- 1466 Earl Cir
- 1327 S 1650 W
- 1251 S 1650 W
- 1481 S Melanie Ln
- 2117 W 1275 S
- 1384 S Melanie Ln
- 922 S 1760 W
- 916 S 1760 W
- 1166 Dallas St
- 2000 S 1800 W
- 1121 W 1290 S
- 1154 W 1700 S
- 1641 S 2350 W Unit B
- 1385 S 1100 W
- 817 S 1350 W
- 2655 S 2430 W Unit 120
- 2665 S 2430 W Unit 118
- 2655 S 2430 W Unit 116
- 2633 S 2430 W Unit 113
- 2614 S 2430 W Unit 106