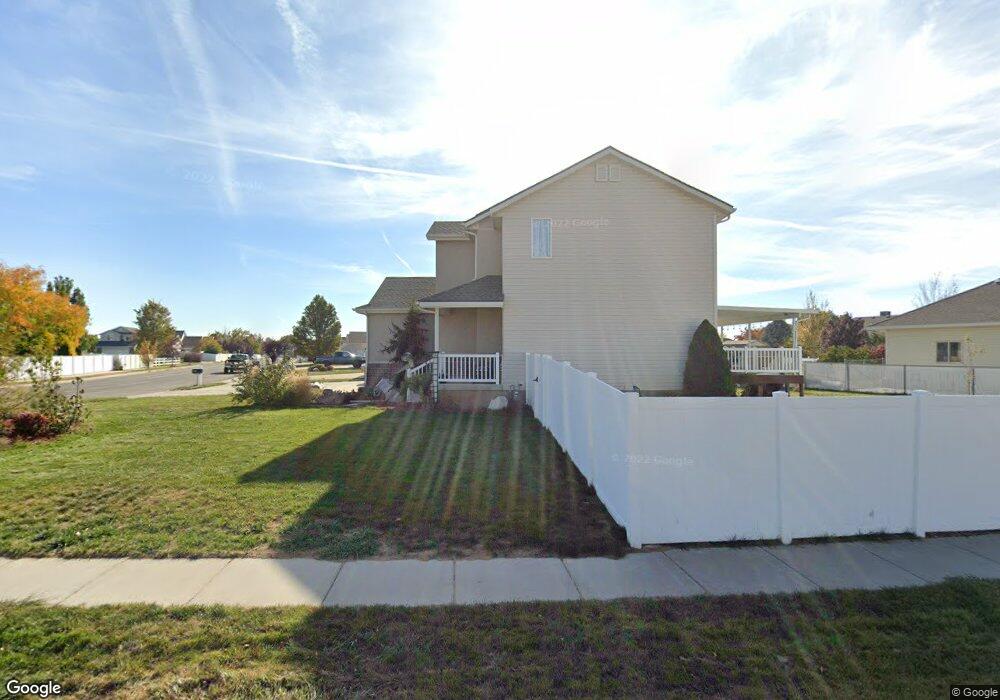
1763 W 525 N West Point, UT 84015
Estimated Value: $520,000 - $577,000
5
Beds
4
Baths
1,649
Sq Ft
$332/Sq Ft
Est. Value
About This Home
This home is located at 1763 W 525 N, West Point, UT 84015 and is currently estimated at $546,876, approximately $331 per square foot. 1763 W 525 N is a home located in Davis County with nearby schools including Lakeside School, West Point Junior High School, and Syracuse High School.
Ownership History
Date
Name
Owned For
Owner Type
Purchase Details
Closed on
Nov 28, 2018
Sold by
Hamblin Shon D and Hamblin Racheal R
Bought by
Homanick Dennis F and Homanick Rebecca J
Current Estimated Value
Home Financials for this Owner
Home Financials are based on the most recent Mortgage that was taken out on this home.
Original Mortgage
$308,000
Outstanding Balance
$270,824
Interest Rate
4.8%
Mortgage Type
VA
Estimated Equity
$276,052
Purchase Details
Closed on
Mar 18, 2002
Sold by
Mark Higley Construction Lc
Bought by
Hamblin Shon D and Hamblin Rachael R
Home Financials for this Owner
Home Financials are based on the most recent Mortgage that was taken out on this home.
Original Mortgage
$150,309
Interest Rate
6.99%
Mortgage Type
FHA
Purchase Details
Closed on
Oct 9, 2001
Sold by
West Ridge Estates Llc
Bought by
Mark Higley Construction Lc
Home Financials for this Owner
Home Financials are based on the most recent Mortgage that was taken out on this home.
Original Mortgage
$133,430
Interest Rate
6.91%
Mortgage Type
Construction
Create a Home Valuation Report for This Property
The Home Valuation Report is an in-depth analysis detailing your home's value as well as a comparison with similar homes in the area
Home Values in the Area
Average Home Value in this Area
Purchase History
| Date | Buyer | Sale Price | Title Company |
|---|---|---|---|
| Homanick Dennis F | -- | Mountain View Title & | |
| Hamblin Shon D | -- | Heritage West Title Insuranc | |
| Mark Higley Construction Lc | -- | Heritage West Title Insuranc |
Source: Public Records
Mortgage History
| Date | Status | Borrower | Loan Amount |
|---|---|---|---|
| Open | Homanick Dennis F | $308,000 | |
| Previous Owner | Hamblin Shon D | $150,309 | |
| Previous Owner | Mark Higley Construction Lc | $133,430 |
Source: Public Records
Tax History Compared to Growth
Tax History
| Year | Tax Paid | Tax Assessment Tax Assessment Total Assessment is a certain percentage of the fair market value that is determined by local assessors to be the total taxable value of land and additions on the property. | Land | Improvement |
|---|---|---|---|---|
| 2025 | $2,958 | $277,200 | $107,052 | $170,148 |
| 2024 | $2,805 | $264,000 | $96,379 | $167,621 |
| 2023 | $2,581 | $447,000 | $120,061 | $326,939 |
| 2022 | $2,797 | $265,101 | $62,431 | $202,670 |
| 2021 | $2,595 | $368,000 | $97,626 | $270,374 |
| 2020 | $2,244 | $314,000 | $82,000 | $232,000 |
| 2019 | $2,174 | $300,000 | $79,560 | $220,440 |
| 2018 | $1,971 | $268,000 | $79,595 | $188,405 |
| 2016 | $1,722 | $123,255 | $30,796 | $92,459 |
| 2015 | $1,708 | $115,830 | $30,796 | $85,034 |
| 2014 | $1,548 | $106,455 | $30,796 | $75,659 |
| 2013 | -- | $85,293 | $31,387 | $53,906 |
Source: Public Records
Map
Nearby Homes
- 1774 W 400 N
- 1652 W 560 N
- 1805 W 675 N
- 1832 W 725 N
- 1827 W 775 N
- 607 N 2000 W
- 575 N 1350 W Unit 137
- 1350 W 300 N Unit 49
- 1350 W 300 N Unit 38
- 1350 W 300 N Unit 29
- 563 N 1350 W Unit 139
- 1337 W 550 N Unit 195
- 47 N 1750 W
- 2132 W 800 N
- 2283 W 470 N
- 423 N 1250 W Unit 118
- 12 N 2000 W Unit 1
- 1828 W 75 S
- 417 N 1200 W Unit 84
- 2348 W 800 N