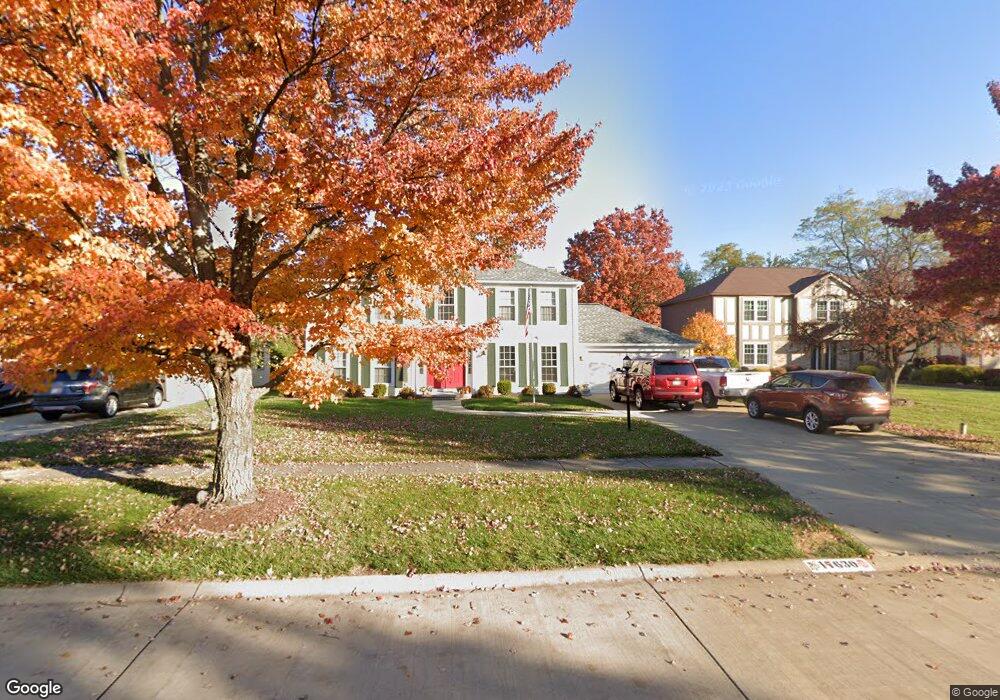
17630 Brandywine Dr Strongsville, OH 44136
Estimated Value: $378,000 - $428,000
4
Beds
3
Baths
2,480
Sq Ft
$159/Sq Ft
Est. Value
About This Home
This home is located at 17630 Brandywine Dr, Strongsville, OH 44136 and is currently estimated at $395,109, approximately $159 per square foot. 17630 Brandywine Dr is a home located in Cuyahoga County with nearby schools including Strongsville High School and Sts Joseph & John Interparochial School.
Ownership History
Date
Name
Owned For
Owner Type
Purchase Details
Closed on
Jul 26, 2024
Sold by
Cukelj Daniel and Cukelj Lore A
Bought by
Dclc Trust and Cukelj
Current Estimated Value
Purchase Details
Closed on
Jul 12, 1999
Sold by
Cukelj Daniel
Bought by
Cukelj Lore A
Purchase Details
Closed on
Apr 1, 1992
Bought by
Cukelj Daniel
Purchase Details
Closed on
Feb 14, 1992
Bought by
Standard Federal Sav & Loan
Purchase Details
Closed on
Jan 17, 1992
Sold by
Spisak Donald J and Spisak Debra S
Bought by
Standard Federal Savings And
Purchase Details
Closed on
Jul 12, 1985
Sold by
Caruso Frank J and Caruso Peggy L
Bought by
Spisak Donald J and Spisak Debra S
Purchase Details
Closed on
Feb 17, 1982
Bought by
Caruso Frank J and Caruso Peggy L
Purchase Details
Closed on
Sep 4, 1981
Bought by
Parkview Corp
Purchase Details
Closed on
Jan 1, 1980
Bought by
Casa Dev Co
Create a Home Valuation Report for This Property
The Home Valuation Report is an in-depth analysis detailing your home's value as well as a comparison with similar homes in the area
Home Values in the Area
Average Home Value in this Area
Purchase History
| Date | Buyer | Sale Price | Title Company |
|---|---|---|---|
| Dclc Trust | -- | Ohio Real Title | |
| Cukelj Lore A | -- | -- | |
| Cukelj Daniel | $145,000 | -- | |
| Federal National Mortgage | -- | -- | |
| Standard Federal Sav & Loan | $139,000 | -- | |
| Standard Federal Savings And | $39,000 | -- | |
| Spisak Donald J | $124,000 | -- | |
| Caruso Frank J | $123,200 | -- | |
| Parkview Corp | -- | -- | |
| Casa Dev Co | -- | -- |
Source: Public Records
Tax History Compared to Growth
Tax History
| Year | Tax Paid | Tax Assessment Tax Assessment Total Assessment is a certain percentage of the fair market value that is determined by local assessors to be the total taxable value of land and additions on the property. | Land | Improvement |
|---|---|---|---|---|
| 2024 | $5,425 | $115,535 | $25,480 | $90,055 |
| 2023 | $5,268 | $84,140 | $21,980 | $62,160 |
| 2022 | $5,230 | $84,140 | $21,980 | $62,160 |
| 2021 | $5,189 | $84,140 | $21,980 | $62,160 |
| 2020 | $5,146 | $73,820 | $19,290 | $54,530 |
| 2019 | $4,995 | $210,900 | $55,100 | $155,800 |
| 2018 | $4,533 | $73,820 | $19,290 | $54,530 |
| 2017 | $4,435 | $66,860 | $15,790 | $51,070 |
| 2016 | $4,399 | $66,860 | $15,790 | $51,070 |
| 2015 | $4,462 | $66,860 | $15,790 | $51,070 |
| 2014 | $4,462 | $66,860 | $15,790 | $51,070 |
Source: Public Records
Map
Nearby Homes
- 17682 Drake Rd
- 17024 Bear Creek Ln
- 18294 Drake Rd
- 17159 Turkey Meadow Ln
- 17934 Cambridge Oval
- 18411 Yorktown Oval
- 16486 S Red Rock Dr
- 16650 Lanier Ave
- 17130 Golden Star Dr
- 18162 Fawn Cir
- 16711 Beech Cir
- 18848 Pearl Rd
- 17259 Woodshire Dr
- 18229 Howe Rd
- 19297 Lauren Way
- 16450 Howe Rd
- 19311 Bradford Ct
- 18630 Shurmer Rd
- 20393 Wildwood Ln
- 15639 Indianhead Ln
- 17614 Brandywine Dr
- 17656 Brandywine Dr
- 17682 Brandywine Dr
- 17588 Brandywine Dr
- 17625 Brandywine Dr
- 17627 Drake Rd
- 17613 Drake Rd
- 17655 Drake Rd
- 17651 Brandywine Dr
- 17603 Brandywine Dr
- 17710 Brandywine Dr
- 17562 Brandywine Dr
- 17599 Drake Rd
- 17669 Drake Rd
- 17677 Brandywine Dr
- 17579 Brandywine Dr
- 17697 Drake Rd
- 17585 Drake Rd
- 17711 Drake Rd
- 17734 Brandywine Dr