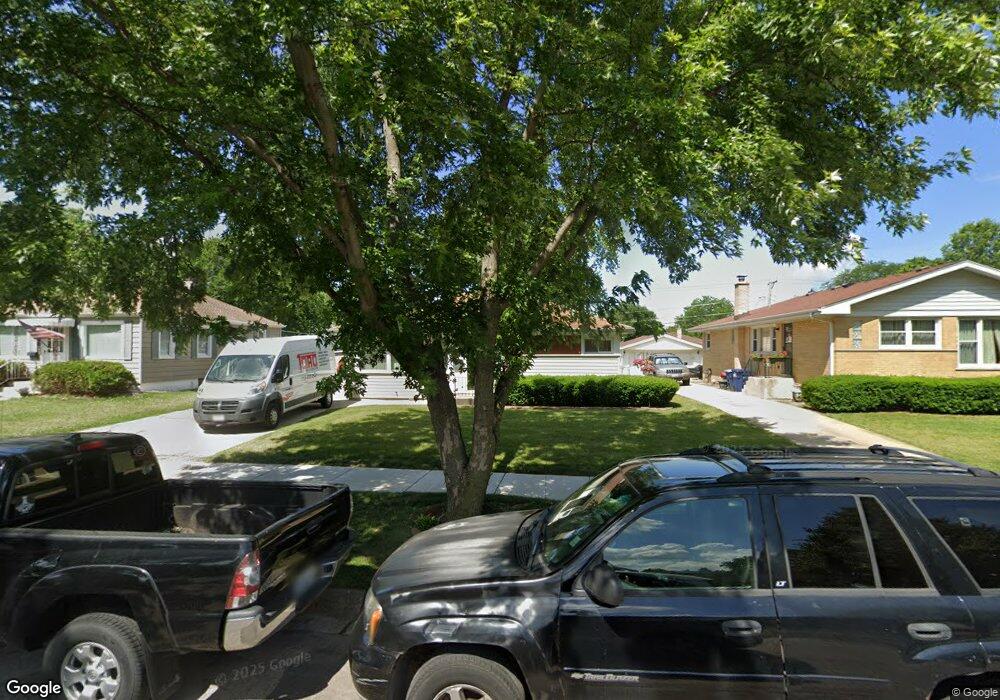
1764 Illinois St Des Plaines, IL 60018
Estimated Value: $342,124 - $402,000
2
Beds
2
Baths
980
Sq Ft
$376/Sq Ft
Est. Value
About This Home
This home is located at 1764 Illinois St, Des Plaines, IL 60018 and is currently estimated at $368,531, approximately $376 per square foot. 1764 Illinois St is a home located in Cook County with nearby schools including South Elementary School, Algonquin Middle School, and Maine West High School.
Ownership History
Date
Name
Owned For
Owner Type
Purchase Details
Closed on
Apr 18, 2014
Sold by
Jurado Elizandro
Bought by
Verde Victor E
Current Estimated Value
Purchase Details
Closed on
Sep 17, 2010
Sold by
Zymantas Timothy and Zymantas Jennifer
Bought by
Jurado Elizandro
Home Financials for this Owner
Home Financials are based on the most recent Mortgage that was taken out on this home.
Original Mortgage
$191,422
Interest Rate
4.25%
Mortgage Type
FHA
Purchase Details
Closed on
Apr 24, 2001
Sold by
Ortega Vivian J
Bought by
Zymantas Timothy and Dewald Jennifer
Home Financials for this Owner
Home Financials are based on the most recent Mortgage that was taken out on this home.
Original Mortgage
$118,400
Interest Rate
6.95%
Purchase Details
Closed on
Oct 25, 1999
Sold by
Interstate Bank
Bought by
Pelletier Joseph M and Pelletier Nancy J
Create a Home Valuation Report for This Property
The Home Valuation Report is an in-depth analysis detailing your home's value as well as a comparison with similar homes in the area
Home Values in the Area
Average Home Value in this Area
Purchase History
| Date | Buyer | Sale Price | Title Company |
|---|---|---|---|
| Verde Victor E | -- | None Available | |
| Jurado Elizandro | $194,000 | Attorneys Title Guaranty Fun | |
| Zymantas Timothy | $148,000 | -- | |
| Pelletier Joseph M | $60,000 | -- |
Source: Public Records
Mortgage History
| Date | Status | Borrower | Loan Amount |
|---|---|---|---|
| Previous Owner | Jurado Elizandro | $191,422 | |
| Previous Owner | Zymantas Timothy | $118,400 |
Source: Public Records
Tax History
| Year | Tax Paid | Tax Assessment Tax Assessment Total Assessment is a certain percentage of the fair market value that is determined by local assessors to be the total taxable value of land and additions on the property. | Land | Improvement |
|---|---|---|---|---|
| 2025 | $5,717 | $31,000 | $5,625 | $25,375 |
| 2024 | $5,717 | $25,849 | $4,688 | $21,161 |
| 2023 | $5,553 | $25,849 | $4,688 | $21,161 |
| 2022 | $5,553 | $25,849 | $4,688 | $21,161 |
| 2021 | $4,508 | $17,995 | $3,906 | $14,089 |
| 2020 | $4,500 | $17,995 | $3,906 | $14,089 |
| 2019 | $4,519 | $20,220 | $3,906 | $16,314 |
| 2018 | $5,133 | $20,599 | $3,437 | $17,162 |
| 2017 | $5,060 | $20,599 | $3,437 | $17,162 |
| 2016 | $5,030 | $20,599 | $3,437 | $17,162 |
| 2015 | $5,051 | $19,332 | $2,968 | $16,364 |
| 2014 | $4,961 | $19,332 | $2,968 | $16,364 |
| 2013 | $4,820 | $19,332 | $2,968 | $16,364 |
Source: Public Records
Map
Nearby Homes
- 1445 Everett Ave
- 1857 Pine St
- 1673 Linden St
- 1881 Orchard St
- 1509 Center St
- 1643 Sycamore St
- 1726 E Lincoln Ave
- 1370 Fargo Ave Unit E
- 1640 S River Rd
- 1895 Birch St
- 1700 E Forest Ave
- 1080 Bogart St
- 1830 Dexter Ln
- 1541 Cooper St
- 2054 Birch St
- 1030 Bogart St
- 1922 Fargo Ave
- 1990 Berry Ln
- 1548 Campbell Ave
- 1458 Kingston Ct
- 1758 Illinois St
- 1772 Illinois St
- 1750 Illinois St
- 1750 Illinois St
- 1786 Illinois St
- 1759 S Elm St
- 1759 S Elm St
- 1767 S Elm St
- 1767 S Elm St
- 1740 Illinois St
- 1755 S Elm St
- 1775 S Elm St
- 1785 S Elm St
- 1747 S Elm St
- 1767 Illinois St
- 1759 Illinois St
- 1732 Illinois St
- 1749 Illinois St
- 1777 Illinois St
- 1777 Illinois St
Your Personal Tour Guide
Ask me questions while you tour the home.