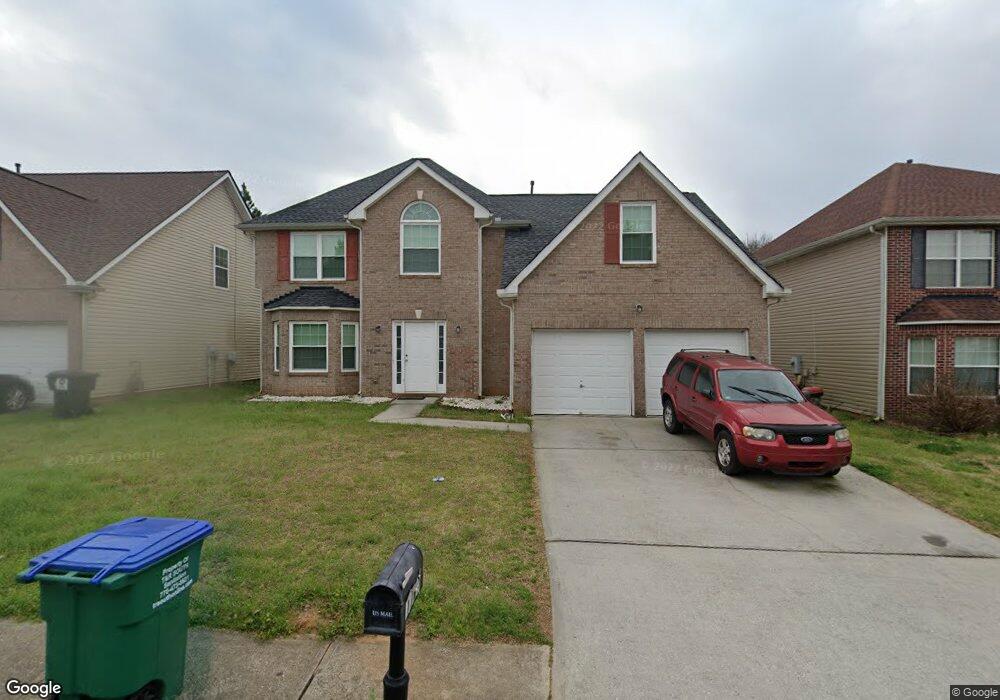
1765 Deer Crossing Cir Jonesboro, GA 30236
Estimated Value: $300,000 - $340,000
4
Beds
3
Baths
2,734
Sq Ft
$117/Sq Ft
Est. Value
About This Home
This home is located at 1765 Deer Crossing Cir, Jonesboro, GA 30236 and is currently estimated at $320,699, approximately $117 per square foot. 1765 Deer Crossing Cir is a home located in Clayton County with nearby schools including Suder Elementary School, Mundys Mill Middle School, and Jonesboro High School.
Ownership History
Date
Name
Owned For
Owner Type
Purchase Details
Closed on
Aug 25, 2010
Sold by
Hud-Housing Of Urban Dev
Bought by
Adelson Rose G
Current Estimated Value
Home Financials for this Owner
Home Financials are based on the most recent Mortgage that was taken out on this home.
Original Mortgage
$97,823
Outstanding Balance
$67,197
Interest Rate
5.25%
Mortgage Type
FHA
Estimated Equity
$253,502
Purchase Details
Closed on
Jan 5, 2010
Sold by
Us Bk National Assn
Bought by
Hud-Housing Of Urban Dev
Purchase Details
Closed on
Feb 5, 2008
Sold by
Wells Fargo Bank Na
Bought by
Altstaetter Heidi L
Home Financials for this Owner
Home Financials are based on the most recent Mortgage that was taken out on this home.
Original Mortgage
$128,981
Interest Rate
5.85%
Mortgage Type
FHA
Purchase Details
Closed on
Oct 2, 2007
Sold by
Adeniyan Felix
Bought by
Wells Fargo Bank Na
Purchase Details
Closed on
Mar 30, 2005
Sold by
Legacy Communities Of The Manor Llc
Bought by
Adeniyan Felix
Home Financials for this Owner
Home Financials are based on the most recent Mortgage that was taken out on this home.
Original Mortgage
$132,886
Interest Rate
6.65%
Mortgage Type
New Conventional
Create a Home Valuation Report for This Property
The Home Valuation Report is an in-depth analysis detailing your home's value as well as a comparison with similar homes in the area
Home Values in the Area
Average Home Value in this Area
Purchase History
| Date | Buyer | Sale Price | Title Company |
|---|---|---|---|
| Adelson Rose G | -- | -- | |
| Hud-Housing Of Urban Dev | -- | -- | |
| Us Bk National Assn | $133,515 | -- | |
| Altstaetter Heidi L | $130,000 | -- | |
| Wells Fargo Bank Na | -- | -- | |
| Adeniyan Felix | $166,200 | -- |
Source: Public Records
Mortgage History
| Date | Status | Borrower | Loan Amount |
|---|---|---|---|
| Open | Adelson Rose G | $97,823 | |
| Previous Owner | Altstaetter Heidi L | $128,981 | |
| Previous Owner | Adeniyan Felix | $132,886 |
Source: Public Records
Tax History Compared to Growth
Tax History
| Year | Tax Paid | Tax Assessment Tax Assessment Total Assessment is a certain percentage of the fair market value that is determined by local assessors to be the total taxable value of land and additions on the property. | Land | Improvement |
|---|---|---|---|---|
| 2024 | $4,646 | $128,120 | $9,600 | $118,520 |
| 2023 | $4,619 | $127,920 | $9,600 | $118,320 |
| 2022 | $3,534 | $99,080 | $9,600 | $89,480 |
| 2021 | $2,752 | $78,720 | $9,600 | $69,120 |
| 2020 | $2,639 | $75,028 | $9,600 | $65,428 |
| 2019 | $2,414 | $68,536 | $9,600 | $58,936 |
| 2018 | $2,181 | $62,778 | $9,600 | $53,178 |
| 2017 | $1,993 | $58,056 | $9,600 | $48,456 |
| 2016 | $1,884 | $55,364 | $9,600 | $45,764 |
| 2015 | $1,492 | $0 | $0 | $0 |
| 2014 | $1,176 | $38,594 | $9,600 | $28,994 |
Source: Public Records
Map
Nearby Homes
- 1770 Deer Crossing Cir
- 1814 Deer Crossing Way
- 9492 Deer Crossing Trace
- 9419 Rocky Creek
- 9510 Creekside Rd
- 1935 Watercrest Dr
- 1720 Byrom Pkwy Unit 2
- 0 Turner Rd Unit 20172270
- 0 Turner Rd Unit 20172265
- 9243 Seminole Rd
- 9176 Chickasaw Ct
- 1879 Lake Chase Ln
- 9396 Fairfield Pkwy
- 9124 Ogala Ct
- 9260 Betony Wood Trail
- 9361 Arbor Glen Ct Unit 13
- 9780 Dixon Industrial Blvd
- 2106 Fair Ridge Ct
- 9132 Endicott Place
- 9806 Dixon Industrial Blvd
- 1759 Deer Crossing Cir
- 1777 Deer Crossing Cir Unit 85
- 1753 Deer Crossing Cir
- 1764 Deer Crossing Cir
- 1758 Deer Crossing Cir
- 1783 Deer Crossing Cir
- 1776 Deer Crossing Cir
- 1752 Deer Crossing Cir
- 1746 Deer Crossing Cir
- 1782 Deer Crossing Cir
- 1789 Deer Crossing Cir
- 1741 Deer Crossing Cir
- 1788 Deer Crossing Cir
- 0 Deer Crossing Cir Unit 8600912
- 0 Deer Crossing Cir Unit 8343744
- 0 Deer Crossing Cir Unit 8043491
- 0 Deer Crossing Cir Unit 7613780
- 0 Deer Crossing Cir Unit 7326751
- 0 Deer Crossing Cir Unit 8347908
- 0 Deer Crossing Cir Unit 8246521