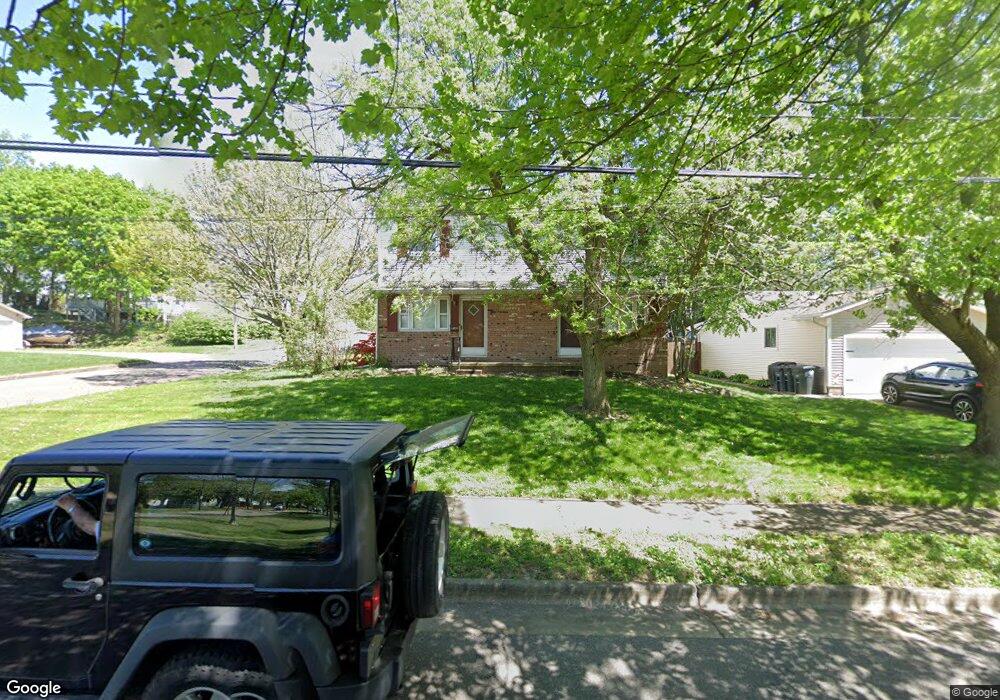
1765 Highview Ave Akron, OH 44301
Firestone Park NeighborhoodEstimated Value: $164,000 - $182,000
4
Beds
2
Baths
1,904
Sq Ft
$91/Sq Ft
Est. Value
About This Home
This home is located at 1765 Highview Ave, Akron, OH 44301 and is currently estimated at $172,705, approximately $90 per square foot. 1765 Highview Ave is a home located in Summit County with nearby schools including Kenmore Garfield Community Learning Center, Eagle Elementary, and Main Preparatory Academy.
Ownership History
Date
Name
Owned For
Owner Type
Purchase Details
Closed on
Sep 26, 2023
Sold by
Didonato Patricia
Bought by
Didonato Daniel Kenneth
Current Estimated Value
Home Financials for this Owner
Home Financials are based on the most recent Mortgage that was taken out on this home.
Original Mortgage
$112,500
Outstanding Balance
$109,857
Interest Rate
7.09%
Mortgage Type
New Conventional
Estimated Equity
$62,848
Purchase Details
Closed on
Dec 28, 2011
Sold by
Ginn Terrence
Bought by
Didonato Rudolph N and Didonato Patricia
Purchase Details
Closed on
Nov 20, 1995
Sold by
Justice Charles E
Bought by
Ginn Terrence
Home Financials for this Owner
Home Financials are based on the most recent Mortgage that was taken out on this home.
Original Mortgage
$73,600
Interest Rate
7.65%
Mortgage Type
New Conventional
Create a Home Valuation Report for This Property
The Home Valuation Report is an in-depth analysis detailing your home's value as well as a comparison with similar homes in the area
Home Values in the Area
Average Home Value in this Area
Purchase History
| Date | Buyer | Sale Price | Title Company |
|---|---|---|---|
| Didonato Daniel Kenneth | $150,000 | None Listed On Document | |
| Didonato Rudolph N | $45,000 | Attorney | |
| Ginn Terrence | $92,000 | -- |
Source: Public Records
Mortgage History
| Date | Status | Borrower | Loan Amount |
|---|---|---|---|
| Open | Didonato Daniel Kenneth | $112,500 | |
| Previous Owner | Ginn Terrence | $73,600 |
Source: Public Records
Tax History
| Year | Tax Paid | Tax Assessment Tax Assessment Total Assessment is a certain percentage of the fair market value that is determined by local assessors to be the total taxable value of land and additions on the property. | Land | Improvement |
|---|---|---|---|---|
| 2025 | $2,714 | $44,941 | $9,636 | $35,305 |
| 2024 | $2,714 | $44,941 | $9,636 | $35,305 |
| 2023 | $2,714 | $44,941 | $9,636 | $35,305 |
| 2022 | $2,561 | $33,048 | $6,983 | $26,065 |
| 2021 | $2,464 | $33,048 | $6,983 | $26,065 |
| 2020 | $2,385 | $33,050 | $6,980 | $26,070 |
| 2019 | $1,338 | $15,580 | $6,980 | $8,600 |
| 2018 | $1,323 | $15,580 | $6,980 | $8,600 |
| 2017 | $1,341 | $15,580 | $6,980 | $8,600 |
| 2016 | $1,342 | $15,580 | $6,980 | $8,600 |
| 2015 | $1,341 | $15,580 | $6,980 | $8,600 |
| 2014 | $1,332 | $15,580 | $6,980 | $8,600 |
| 2013 | $2,111 | $26,250 | $6,980 | $19,270 |
Source: Public Records
Map
Nearby Homes
- 1726 Coventry St
- 1708 Highview Ave
- 1645 Hammel St
- 1646 Highview Ave
- 695 Cooper Ave
- 1620 Highview Ave
- 502 E Woodsdale Ave
- 1612 Oakwood Ave
- 1595 Redwood Ave
- 1810 Carter Ave
- 1878 Carter Ave Unit 1880
- 367 Wayne Ave
- 457 S Firestone Blvd
- 378 Cypress Ave
- 449 Palm Ave
- 1835 Thornapple Ave
- 1500 Beardsley St
- 248 E Catawba Ave
- 244 E Catawba Ave
- 801 Triplett Blvd
- 1763 Highview Ave Unit 1765
- 1773 Highview Ave
- 1744 Coventry St Unit 1746
- 1744 Coventry St Unit 1746
- 1744 Coventry St
- 1777 Highview Ave
- 1753 Highview Ave
- 1752 Coventry St
- 1744 1746 Coventry St
- 1820 Clinton
- 6066 Clinton
- 1781 Highview Ave
- 1732 Coventry St
- 1758 Coventry St
- 2325 Clinton
- 1754 Highview Ave
- 1787 Highview Ave
- 1762 Coventry St
- 1762 Coventry St
- 1745 Highview Ave
Your Personal Tour Guide
Ask me questions while you tour the home.