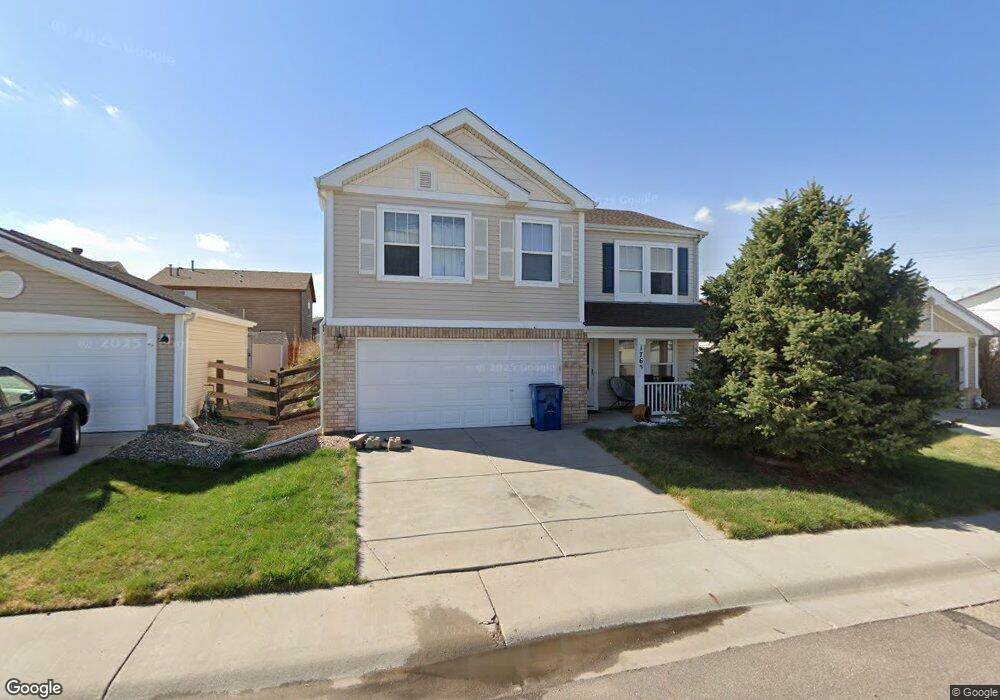
1765 Zephyr St Brighton, CO 80603
Estimated Value: $448,266 - $477,000
3
Beds
3
Baths
1,856
Sq Ft
$246/Sq Ft
Est. Value
About This Home
This home is located at 1765 Zephyr St, Brighton, CO 80603 and is currently estimated at $456,067, approximately $245 per square foot. 1765 Zephyr St is a home located in Weld County with nearby schools including Weld Central Senior High School and Bromley East Charter School.
Ownership History
Date
Name
Owned For
Owner Type
Purchase Details
Closed on
May 26, 2006
Sold by
Trail Ridge Homes At Blue Lake Llc
Bought by
Barrett Burton Jaasmyn
Current Estimated Value
Home Financials for this Owner
Home Financials are based on the most recent Mortgage that was taken out on this home.
Original Mortgage
$164,544
Outstanding Balance
$96,359
Interest Rate
6.5%
Mortgage Type
Fannie Mae Freddie Mac
Estimated Equity
$359,708
Create a Home Valuation Report for This Property
The Home Valuation Report is an in-depth analysis detailing your home's value as well as a comparison with similar homes in the area
Home Values in the Area
Average Home Value in this Area
Purchase History
| Date | Buyer | Sale Price | Title Company |
|---|---|---|---|
| Barrett Burton Jaasmyn | $205,680 | Fahtco |
Source: Public Records
Mortgage History
| Date | Status | Borrower | Loan Amount |
|---|---|---|---|
| Open | Barrett Burton Jaasmyn | $164,544 |
Source: Public Records
Tax History Compared to Growth
Tax History
| Year | Tax Paid | Tax Assessment Tax Assessment Total Assessment is a certain percentage of the fair market value that is determined by local assessors to be the total taxable value of land and additions on the property. | Land | Improvement |
|---|---|---|---|---|
| 2025 | $3,367 | $26,230 | $5,630 | $20,600 |
| 2024 | $3,367 | $26,230 | $5,630 | $20,600 |
| 2023 | $2,910 | $29,990 | $6,090 | $23,900 |
| 2022 | $2,628 | $22,810 | $4,730 | $18,080 |
| 2021 | $2,900 | $23,460 | $4,860 | $18,600 |
| 2020 | $2,802 | $20,940 | $3,220 | $17,720 |
| 2019 | $2,630 | $20,940 | $3,220 | $17,720 |
| 2018 | $2,170 | $16,490 | $3,240 | $13,250 |
| 2017 | $2,125 | $16,490 | $3,240 | $13,250 |
| 2016 | $1,590 | $13,500 | $2,390 | $11,110 |
| 2015 | $1,486 | $13,500 | $2,390 | $11,110 |
| 2014 | $1,177 | $10,300 | $1,990 | $8,310 |
Source: Public Records
Map
Nearby Homes