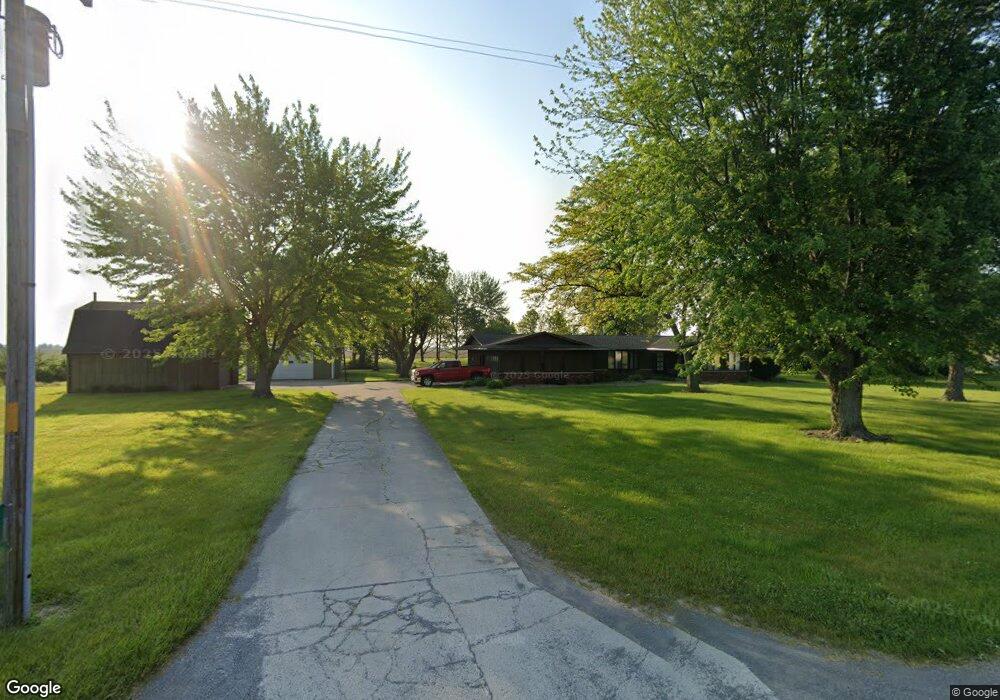
17653 Road 20p Fort Jennings, OH 45844
Estimated Value: $249,000 - $318,000
4
Beds
3
Baths
2,244
Sq Ft
$130/Sq Ft
Est. Value
About This Home
This home is located at 17653 Road 20p, Fort Jennings, OH 45844 and is currently estimated at $291,187, approximately $129 per square foot. 17653 Road 20p is a home located in Putnam County with nearby schools including Fort Jennings Elementary School and Fort Jennings High School.
Ownership History
Date
Name
Owned For
Owner Type
Purchase Details
Closed on
Jul 22, 2024
Sold by
Kazee April M
Bought by
Ricker Ian and Ricker Hannah
Current Estimated Value
Home Financials for this Owner
Home Financials are based on the most recent Mortgage that was taken out on this home.
Original Mortgage
$198,000
Outstanding Balance
$196,672
Interest Rate
6.99%
Mortgage Type
Credit Line Revolving
Estimated Equity
$94,515
Purchase Details
Closed on
Dec 19, 2018
Sold by
Kazee Kyle M
Bought by
Kazee April M
Purchase Details
Closed on
Aug 15, 2015
Home Financials for this Owner
Home Financials are based on the most recent Mortgage that was taken out on this home.
Interest Rate
3.94%
Purchase Details
Closed on
Aug 14, 2015
Sold by
Osting Ronald U and Osting Jill A
Bought by
Kazee Kyle M and Kazee April M
Home Financials for this Owner
Home Financials are based on the most recent Mortgage that was taken out on this home.
Interest Rate
3.94%
Purchase Details
Closed on
Jul 15, 2014
Home Financials for this Owner
Home Financials are based on the most recent Mortgage that was taken out on this home.
Interest Rate
4.15%
Create a Home Valuation Report for This Property
The Home Valuation Report is an in-depth analysis detailing your home's value as well as a comparison with similar homes in the area
Home Values in the Area
Average Home Value in this Area
Purchase History
| Date | Buyer | Sale Price | Title Company |
|---|---|---|---|
| Ricker Ian | $235,000 | None Listed On Document | |
| Kazee April M | -- | None Available | |
| -- | $128,239 | -- | |
| Kazee Kyle M | $128,300 | Attorney | |
| -- | $170,000 | -- |
Source: Public Records
Mortgage History
| Date | Status | Borrower | Loan Amount |
|---|---|---|---|
| Open | Ricker Ian | $198,000 | |
| Previous Owner | Kazee Kyle M | $178,000 | |
| Previous Owner | -- | -- | |
| Previous Owner | Kazee Kyle M | $130,933 | |
| Previous Owner | -- | -- |
Source: Public Records
Tax History Compared to Growth
Tax History
| Year | Tax Paid | Tax Assessment Tax Assessment Total Assessment is a certain percentage of the fair market value that is determined by local assessors to be the total taxable value of land and additions on the property. | Land | Improvement |
|---|---|---|---|---|
| 2024 | $2,429 | $83,840 | $8,380 | $75,460 |
| 2023 | $2,503 | $65,810 | $6,170 | $59,640 |
| 2022 | $2,184 | $65,811 | $6,171 | $59,640 |
| 2021 | $2,194 | $65,810 | $6,170 | $59,640 |
| 2020 | $2,195 | $47,430 | $5,310 | $42,120 |
| 2019 | $1,916 | $57,620 | $6,170 | $51,450 |
| 2018 | $1,897 | $57,620 | $6,170 | $51,450 |
| 2017 | $1,573 | $57,620 | $6,170 | $51,450 |
| 2016 | $1,573 | $47,430 | $5,310 | $42,120 |
| 2015 | $1,727 | $47,430 | $5,310 | $42,120 |
| 2014 | $1,746 | $47,430 | $5,310 | $42,120 |
| 2013 | $1,781 | $47,430 | $5,310 | $42,120 |
Source: Public Records
Map
Nearby Homes
- 17736 Road 20p
- 20501 U S 224
- 0 Heritage Cir Unit 6112034
- 0 Heritage Cir Unit 303239
- 0 Road 24-Q
- 320 Auglaize St
- 7510 State Route 66
- 1220 Rose Anna Dr
- 1303 Carolyn Dr
- 106 Carnation St
- 650 E 6th St
- 810 N Franklin St
- 704 N Franklin St
- 903 E 3rd St
- 821 E 3rd St
- 610 N Washington St
- 15105 Road 15m
- 6585 Huffer Rd
- 633 E 2nd St
- 405 N Franklin St
- 17654 Road 20p
- 17622 Road 20p
- 17702 Road 20p
- 17719 Road 20p
- 17745 Road 20p
- 17561 Road 20p
- 17560 Road 20p
- 17765 Road 20p
- 17752 Road 20p
- 17806 Road 20p
- 17465 Road 20p
- 17460 Road 20p
- 21520 Road R
- 17445 State Route 190
- 17509 State Route 190
- 17623 State Route 190
- 17681 State Route 190
- 17520 State Route 190
- 17337 State Route 190