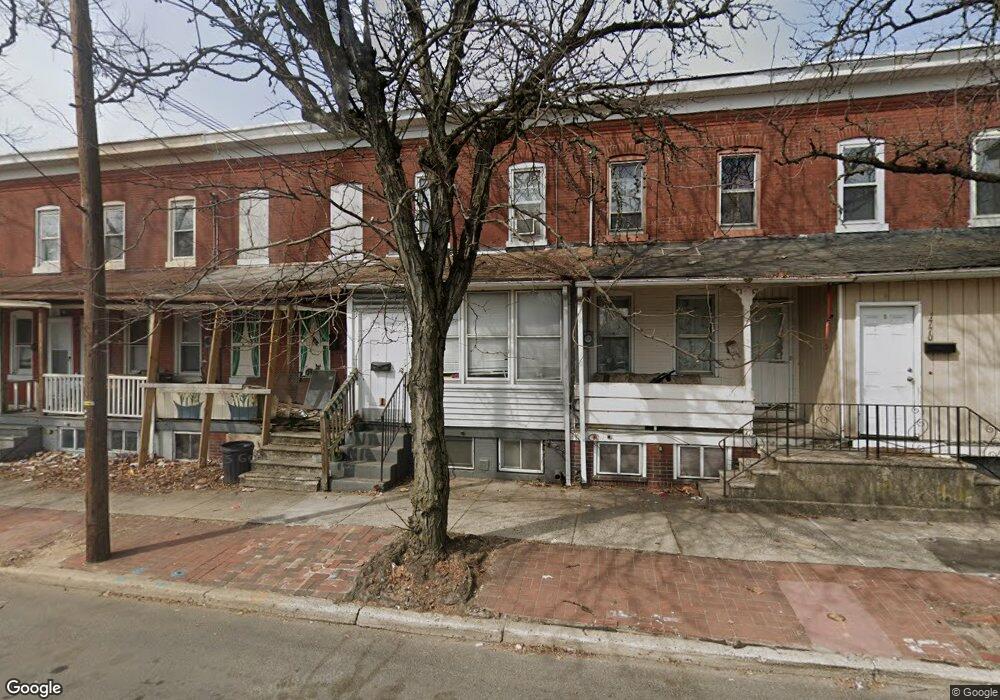
1766 E State St Trenton, NJ 08609
Estimated Value: $187,433 - $267,000
3
Beds
1
Bath
1,160
Sq Ft
$198/Sq Ft
Est. Value
About This Home
This home is located at 1766 E State St, Trenton, NJ 08609 and is currently estimated at $229,811, approximately $198 per square foot. 1766 E State St is a home located in Mercer County with nearby schools including Klockner Elementary School, Richard C. Crockett Middle School, and Nottingham High School - North.
Ownership History
Date
Name
Owned For
Owner Type
Purchase Details
Closed on
Jun 30, 2022
Sold by
Yeki Realty Llc
Bought by
Rga Holdings Llc
Current Estimated Value
Home Financials for this Owner
Home Financials are based on the most recent Mortgage that was taken out on this home.
Original Mortgage
$1,542,800
Outstanding Balance
$1,465,657
Interest Rate
5.09%
Mortgage Type
New Conventional
Estimated Equity
-$1,235,846
Purchase Details
Closed on
Dec 21, 2020
Sold by
Mann David E
Bought by
Yeki Realty Llc
Purchase Details
Closed on
Feb 25, 2005
Sold by
Ayuby Omar
Bought by
Mann David
Home Financials for this Owner
Home Financials are based on the most recent Mortgage that was taken out on this home.
Original Mortgage
$67,500
Interest Rate
5.64%
Mortgage Type
Purchase Money Mortgage
Purchase Details
Closed on
Dec 21, 1995
Sold by
Liberty Sav Bk
Bought by
Ayuby Omar M
Create a Home Valuation Report for This Property
The Home Valuation Report is an in-depth analysis detailing your home's value as well as a comparison with similar homes in the area
Home Values in the Area
Average Home Value in this Area
Purchase History
| Date | Buyer | Sale Price | Title Company |
|---|---|---|---|
| Rga Holdings Llc | -- | Stewart Title | |
| Rga Holdings Llc | -- | Stewart Title | |
| Yeki Realty Llc | $55,000 | River Edge Title | |
| Mann David | $75,000 | -- | |
| Ayuby Omar M | $20,000 | -- |
Source: Public Records
Mortgage History
| Date | Status | Borrower | Loan Amount |
|---|---|---|---|
| Open | Rga Holdings Llc | $1,542,800 | |
| Closed | Rga Holdings Llc | $1,542,800 | |
| Previous Owner | Mann David | $67,500 |
Source: Public Records
Tax History Compared to Growth
Tax History
| Year | Tax Paid | Tax Assessment Tax Assessment Total Assessment is a certain percentage of the fair market value that is determined by local assessors to be the total taxable value of land and additions on the property. | Land | Improvement |
|---|---|---|---|---|
| 2025 | $1,692 | $48,000 | $15,800 | $32,200 |
| 2024 | $1,585 | $48,000 | $15,800 | $32,200 |
| 2023 | $1,585 | $48,000 | $15,800 | $32,200 |
| 2022 | $1,560 | $48,000 | $15,800 | $32,200 |
| 2021 | $1,845 | $48,000 | $15,800 | $32,200 |
| 2020 | $1,672 | $48,000 | $15,800 | $32,200 |
| 2019 | $1,630 | $48,000 | $15,800 | $32,200 |
| 2018 | $1,588 | $48,000 | $15,800 | $32,200 |
| 2017 | $1,547 | $48,000 | $15,800 | $32,200 |
| 2016 | $1,298 | $48,000 | $15,800 | $32,200 |
| 2015 | $2,076 | $41,200 | $8,000 | $33,200 |
| 2014 | $2,036 | $41,200 | $8,000 | $33,200 |
Source: Public Records
Map
Nearby Homes
- 1335 Nottingham Way
- 194 Atlantic Ave
- 19 Scammel Ave
- 81 3rd Ave
- 120 3rd Ave
- 38 Mechanics Ave
- 30 Mechanics Ave
- 80 Fourth
- 43 1/2 S Logan Ave
- 359 Saint Joes Ave
- 82-84 Ward Ave
- 151 S Logan Ave
- 116 Cleveland Ave
- 448 Lynwood Ave
- 63 Garfield Ave
- 66 N Olden Ave
- 101 Sherman Ave
- 103 Sherman Ave
- 224 Garfield Ave
- 1524 Elizabeth Ave
- 1764 E State St
- 1762 E State St
- 1760 E State St
- 1768 E State St
- 1758 E State St
- 1770 E State St
- 1756 E State St
- 1754 E State St
- 1752 E State St
- 1750 E State St
- 1748 E State St
- 1755 Roberts Ave
- 1746 E State St
- 1744 E State St
- 1742 E State St
- 1753 Roberts Ave
- 1765 E State St
- 1740 E State St
- 1778 E State St