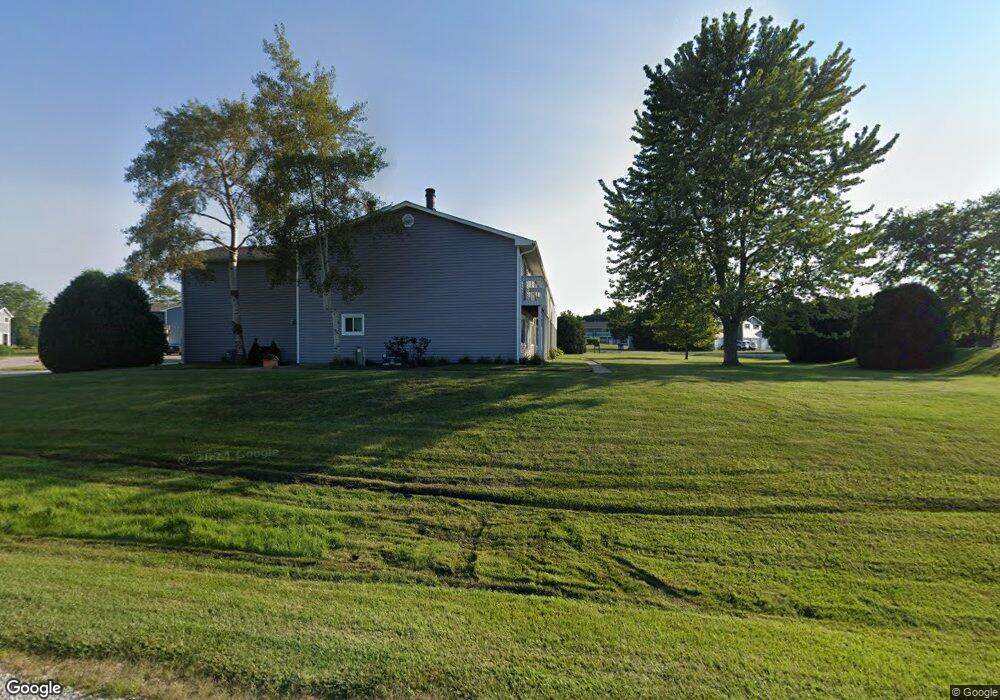
17671 W Walnut Ln Unit 4B Gurnee, IL 60031
Estimated Value: $229,852 - $279,000
2
Beds
2
Baths
1,320
Sq Ft
$184/Sq Ft
Est. Value
About This Home
This home is located at 17671 W Walnut Ln Unit 4B, Gurnee, IL 60031 and is currently estimated at $243,213, approximately $184 per square foot. 17671 W Walnut Ln Unit 4B is a home located in Lake County with nearby schools including Woodland Primary School, Woodland Elementary School, and Woodland Intermediate School.
Ownership History
Date
Name
Owned For
Owner Type
Purchase Details
Closed on
Jul 9, 2019
Sold by
Tucibat Robert W
Bought by
Tucibat Robert W and Robert W Tucibat Ii Revocable Trust
Current Estimated Value
Purchase Details
Closed on
May 11, 2001
Sold by
Koncel Jennifer J
Bought by
Tucibat Ii Robert W
Home Financials for this Owner
Home Financials are based on the most recent Mortgage that was taken out on this home.
Original Mortgage
$115,200
Interest Rate
7.14%
Mortgage Type
Purchase Money Mortgage
Purchase Details
Closed on
Jun 20, 2000
Sold by
Byrne Martin J
Bought by
Koncel Jennifer J
Home Financials for this Owner
Home Financials are based on the most recent Mortgage that was taken out on this home.
Original Mortgage
$108,500
Interest Rate
8.66%
Mortgage Type
FHA
Create a Home Valuation Report for This Property
The Home Valuation Report is an in-depth analysis detailing your home's value as well as a comparison with similar homes in the area
Home Values in the Area
Average Home Value in this Area
Purchase History
| Date | Buyer | Sale Price | Title Company |
|---|---|---|---|
| Tucibat Robert W | -- | Attorney | |
| Tucibat Ii Robert W | $128,000 | -- | |
| Koncel Jennifer J | $112,000 | -- |
Source: Public Records
Mortgage History
| Date | Status | Borrower | Loan Amount |
|---|---|---|---|
| Previous Owner | Tucibat Ii Robert W | $115,200 | |
| Previous Owner | Koncel Jennifer J | $108,500 |
Source: Public Records
Tax History Compared to Growth
Tax History
| Year | Tax Paid | Tax Assessment Tax Assessment Total Assessment is a certain percentage of the fair market value that is determined by local assessors to be the total taxable value of land and additions on the property. | Land | Improvement |
|---|---|---|---|---|
| 2024 | $4,241 | $56,735 | $6,023 | $50,712 |
| 2023 | $3,890 | $52,674 | $5,592 | $47,082 |
| 2022 | $3,890 | $45,179 | $5,593 | $39,586 |
| 2021 | $3,504 | $43,367 | $5,369 | $37,998 |
| 2020 | $3,363 | $42,301 | $5,237 | $37,064 |
| 2019 | $3,293 | $41,073 | $5,085 | $35,988 |
| 2018 | $1,958 | $27,532 | $3,279 | $24,253 |
| 2017 | $1,956 | $26,743 | $3,185 | $23,558 |
| 2016 | $1,929 | $25,552 | $3,043 | $22,509 |
| 2015 | $1,852 | $24,234 | $2,886 | $21,348 |
| 2014 | $2,804 | $33,731 | $2,847 | $30,884 |
| 2012 | $2,667 | $33,990 | $2,869 | $31,121 |
Source: Public Records
Map
Nearby Homes
- 17298 W Maple Ln
- 17404 W Walnut Ln Unit 2C
- 17438 W Walnut Ln Unit 2F
- 34026 N White Oak Ln Unit 48C
- 34395 W Saddle Ct
- 34110 N White Oak Ln Unit 37B
- 17716 W Horseshoe Ln Unit 3
- 17490 Pin Oak Ln
- 17444 Pin Oak Ln
- 35051 N Oak Knoll Cir
- 6183 Old Farm Ln Unit 3
- 6296 Doral Dr
- 7449 Brentwood Ln
- 17613 W Meadowbrook Dr
- 18238 W Gages Lake Rd
- 17603 W Windslow Dr
- 1075 Suffolk Ct
- 17830 W Winnebago Dr
- 415 Kingsport Dr
- 706 Owl Creek Ln
- 17655 W Walnut Ln Unit 4D
- 17667 W Walnut Ln Unit 4C
- 17643 W Walnut Ln Unit 4E
- 17639 W Walnut Ln Unit 4F
- 17693 W Walnut Ln Unit 4A
- 17541 W Walnut Ln Unit 3C
- 17533 W Walnut Ln Unit 3B
- 17553 W Walnut Ln Unit 3D
- 17561 W Walnut Ln Unit 3E
- 17575 W Walnut Ln Unit 3F
- 17354 W Maple Ln Unit 17F
- 17352 W Maple Ln Unit 17E
- 17401 W Chestnut Ln Unit 5C
- 17350 W Maple Ln Unit D17
- 17391 W Chestnut Ln Unit 6D
- 17348 W Maple Ln Unit C17
- 17399 W Chestnut Ln Unit 5D
- 17393 W Chestnut Ln Unit 6C
- 17346 W Maple Ln
- 17328 W Maple Ln Unit B