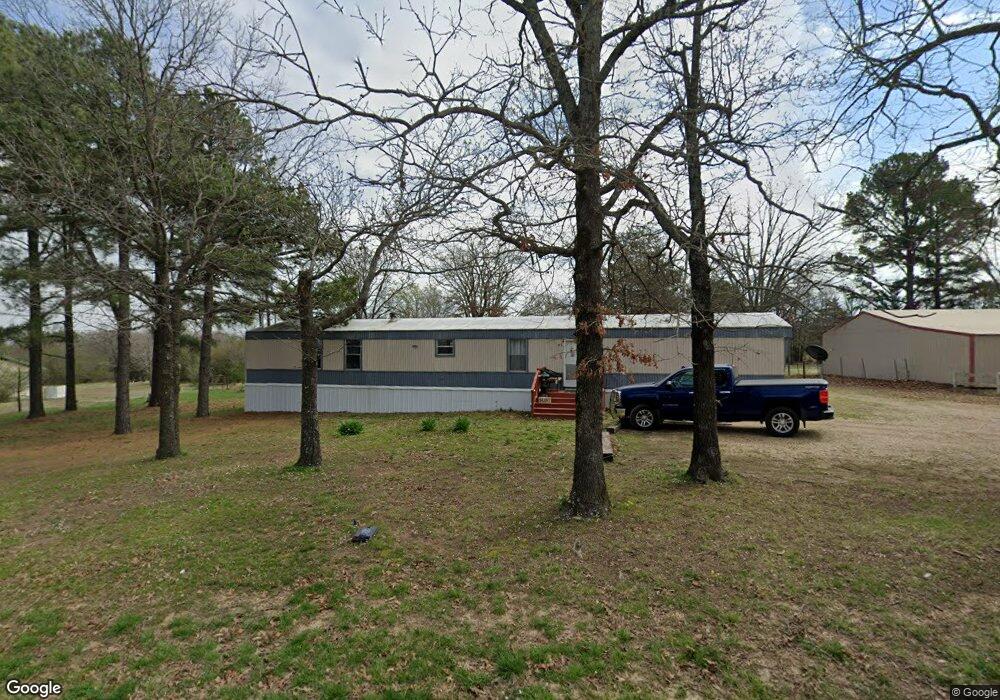
17678 S Rocky Top Ln Tahlequah, OK 74464
Estimated Value: $80,310 - $129,000
3
Beds
1
Bath
924
Sq Ft
$121/Sq Ft
Est. Value
About This Home
This home is located at 17678 S Rocky Top Ln, Tahlequah, OK 74464 and is currently estimated at $111,770, approximately $120 per square foot. 17678 S Rocky Top Ln is a home located in Cherokee County with nearby schools including Briggs Public School and Boudinot Christian School.
Ownership History
Date
Name
Owned For
Owner Type
Purchase Details
Closed on
Jun 9, 2016
Sold by
Hix M Sue
Bought by
Hullinger Jimmy D and Hullinger Sherry J
Current Estimated Value
Purchase Details
Closed on
Jun 13, 2015
Sold by
Day Cooper Sinclaire and Day Sherry Kay
Bought by
Mary Sue Hix Living Trust
Purchase Details
Closed on
Mar 6, 2006
Sold by
Mary Sue Hix Living Trust
Bought by
Day Cooper Sinclaire and Day Sherry Kay
Home Financials for this Owner
Home Financials are based on the most recent Mortgage that was taken out on this home.
Original Mortgage
$50,000
Interest Rate
6.05%
Mortgage Type
Unknown
Purchase Details
Closed on
Apr 11, 2002
Sold by
Nancy J Badwound
Bought by
Mary Sue Hix Cramberg
Purchase Details
Closed on
Dec 14, 1998
Sold by
Rideout Roland T and Rideout Anna J
Bought by
Nancy J Badwound
Purchase Details
Closed on
Jun 23, 1994
Sold by
Patsy Duane D and Patsy Gillaspie
Bought by
Rideout Roland T and Rideout Anna J
Create a Home Valuation Report for This Property
The Home Valuation Report is an in-depth analysis detailing your home's value as well as a comparison with similar homes in the area
Home Values in the Area
Average Home Value in this Area
Purchase History
| Date | Buyer | Sale Price | Title Company |
|---|---|---|---|
| Hullinger Jimmy D | $25,000 | None Available | |
| Mary Sue Hix Living Trust | -- | None Available | |
| Day Cooper Sinclaire | $50,000 | None Available | |
| Mary Sue Hix Cramberg | $37,000 | -- | |
| Nancy J Badwound | $32,500 | -- | |
| Rideout Roland T | $2,500 | -- |
Source: Public Records
Mortgage History
| Date | Status | Borrower | Loan Amount |
|---|---|---|---|
| Previous Owner | Day Cooper Sinclaire | $50,000 |
Source: Public Records
Tax History Compared to Growth
Tax History
| Year | Tax Paid | Tax Assessment Tax Assessment Total Assessment is a certain percentage of the fair market value that is determined by local assessors to be the total taxable value of land and additions on the property. | Land | Improvement |
|---|---|---|---|---|
| 2025 | $103 | $1,314 | $556 | $758 |
| 2024 | $103 | $1,252 | $530 | $722 |
| 2023 | $103 | $1,192 | $469 | $723 |
| 2022 | $102 | $1,192 | $469 | $723 |
| 2021 | $94 | $1,192 | $469 | $723 |
| 2020 | $94 | $1,192 | $469 | $723 |
| 2019 | $128 | $1,602 | $510 | $1,092 |
| 2018 | $130 | $1,602 | $510 | $1,092 |
| 2017 | $131 | $1,602 | $510 | $1,092 |
| 2016 | $204 | $2,479 | $510 | $1,969 |
| 2015 | $164 | $2,361 | $510 | $1,851 |
| 2014 | $164 | $2,361 | $510 | $1,851 |
Source: Public Records
Map
Nearby Homes
- 8147 N 544 Rd
- 0 S Cary Ln
- 0 Hwy 10 N Unit 2514793
- 24500 E 741 Rd
- 0000 E Salvation Rd
- 17022 S 579 Rd
- 25182 E 770 Rd
- 16527 N Highway 10
- 0093 S Acres S (93 Acres) S Welling Rd
- 2205 Oakridge Dr
- 2000 Tarkington St
- 20413 E Allen Rd
- 17730 S Old Highway 62
- 20596 E Whipperwill Rd
- 1390 N Legion Dr
- 1518 E Hogner St
- 1505 E Summerfield St
- 0 550 Rd
- 18781 S 526 Rd
- 407 N Bliss Ave
- 17692 S Rocky Top Ln
- 17628 S Rocky Top Ln
- 17706 S Rocky Top Ln
- 17627 S Rockytop Ln
- 17751 S Rocky Top Ln
- 17770 S Rocky Top Ln
- 17761 S Rocky Top Ln
- 17599 S Rocky Top Ln
- 17795 S Rocky Top Ln
- 17519 S Rockytop Ln
- 17836 S Rocky Top Ln
- 17779 S Cary Ln
- 22854 Highway 51
- 17898 S Rocky Top Ln
- 22667 E 775 Rd Unit 8
- 17866 S Rocky Top Ln
- 17899 S Rocky Top Ln
- 22637 E 775 Rd Unit 5
- 22641 E 775 Rd Unit 6
- 22627 E 775 Rd Unit 3