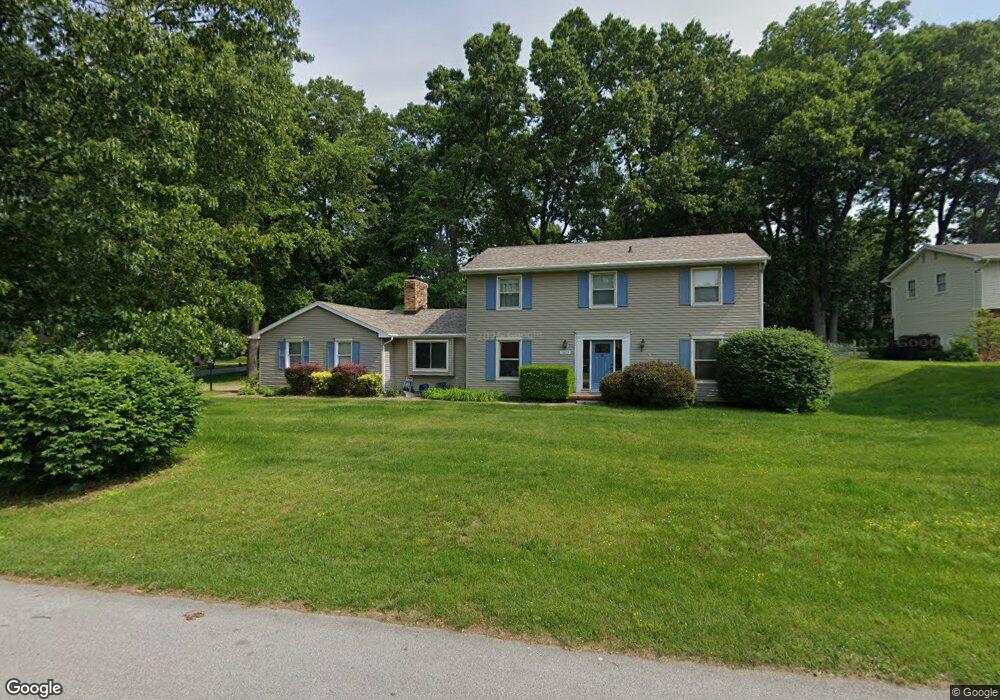
17679 Parrish Ct South Bend, IN 46635
Estimated Value: $334,449 - $393,000
4
Beds
3
Baths
2,156
Sq Ft
$163/Sq Ft
Est. Value
About This Home
This home is located at 17679 Parrish Ct, South Bend, IN 46635 and is currently estimated at $351,612, approximately $163 per square foot. 17679 Parrish Ct is a home located in St. Joseph County with nearby schools including Cora B. Darling Elementary School, Clay Intermediate Center, and Tarkington Traditional School.
Ownership History
Date
Name
Owned For
Owner Type
Purchase Details
Closed on
Oct 23, 2007
Sold by
Delong Ty and Delong Kindalee
Bought by
Heintzelman Eric H and Heintzelman Kristin D
Current Estimated Value
Home Financials for this Owner
Home Financials are based on the most recent Mortgage that was taken out on this home.
Original Mortgage
$130,000
Outstanding Balance
$82,133
Interest Rate
6.44%
Mortgage Type
New Conventional
Estimated Equity
$269,479
Create a Home Valuation Report for This Property
The Home Valuation Report is an in-depth analysis detailing your home's value as well as a comparison with similar homes in the area
Home Values in the Area
Average Home Value in this Area
Purchase History
| Date | Buyer | Sale Price | Title Company |
|---|---|---|---|
| Heintzelman Eric H | -- | Meridian Title |
Source: Public Records
Mortgage History
| Date | Status | Borrower | Loan Amount |
|---|---|---|---|
| Open | Heintzelman Eric H | $130,000 |
Source: Public Records
Tax History Compared to Growth
Tax History
| Year | Tax Paid | Tax Assessment Tax Assessment Total Assessment is a certain percentage of the fair market value that is determined by local assessors to be the total taxable value of land and additions on the property. | Land | Improvement |
|---|---|---|---|---|
| 2024 | $2,395 | $294,600 | $90,100 | $204,500 |
| 2023 | $3,142 | $231,900 | $90,100 | $141,800 |
| 2022 | $3,142 | $270,900 | $101,200 | $169,700 |
| 2021 | $2,729 | $222,000 | $66,700 | $155,300 |
| 2020 | $2,480 | $202,300 | $65,500 | $136,800 |
| 2019 | $2,157 | $210,900 | $63,000 | $147,900 |
| 2018 | $2,070 | $192,500 | $57,100 | $135,400 |
| 2017 | $1,891 | $172,500 | $49,200 | $123,300 |
| 2016 | $1,626 | $152,100 | $48,300 | $103,800 |
| 2014 | $1,620 | $150,700 | $48,300 | $102,400 |
Source: Public Records
Map
Nearby Homes
- 52186 Woodridge Dr
- 17633 Cobblestone Ct
- 17328 Deerfield Loop
- 17378 Woodhurst Rd
- 51766 Villager Pkwy
- 52284 Farmington Square Rd
- 18193 Windmill Ct
- 51630 Waterford Ln
- 18268 Clairmont Dr
- 18268 Burton Dr
- 18330 Farm Ln
- 51527 Summer Hill Dr
- 18391 Crownhill Dr
- 51757 Hickory Rd
- 18225 Amberly Ln
- 52836 Arbor Dr
- 52145 Brookview Ct
- 51793 Heath Ct
- 18120 Chipstead Dr
- 52200 Wembley Dr
- 17663 Parrish Ct
- 17680 Hansom Ct
- 17666 Hansom Ct
- 52153 Carriage Hills Dr
- 17686 Parrish Ct
- 52175 Carriage Hills Dr
- 17668 Parrish Ct
- 52131 Carriage Hills Dr
- 17646 Hansom Ct
- 17643 Parrish Ct
- 52176 Carriage Hills Dr
- 17656 Parrish Ct
- 52109 Carriage Hills Dr
- 17631 Parrish Ct
- 52203 Carriage Hills Dr
- 52152 Woodridge Dr
- 17640 Hansom Ct
- 52216 Carriage Hills Dr
- 52170 Woodridge Dr
- 17687 Cobblestone Ct