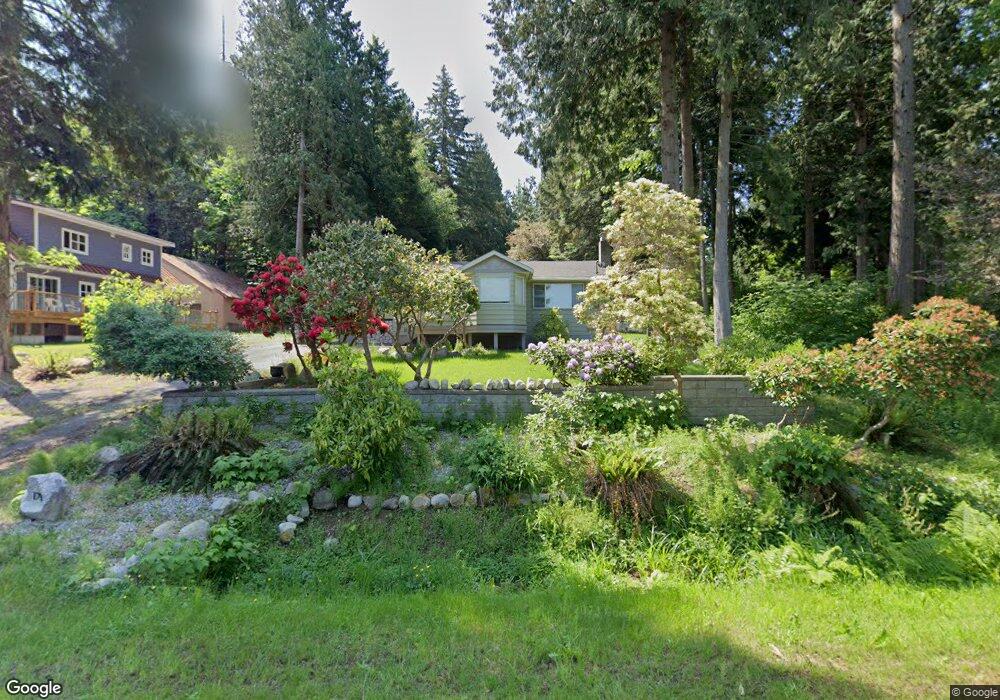
1769 Cliff Rd Point Roberts, WA 98281
Estimated Value: $440,765 - $492,000
3
Beds
2
Baths
1,747
Sq Ft
$271/Sq Ft
Est. Value
About This Home
This home is located at 1769 Cliff Rd, Point Roberts, WA 98281 and is currently estimated at $473,691, approximately $271 per square foot. 1769 Cliff Rd is a home located in Whatcom County with nearby schools including Point Roberts Primary School, Blaine Middle School, and Blaine High School.
Ownership History
Date
Name
Owned For
Owner Type
Purchase Details
Closed on
Dec 3, 2010
Sold by
Nutt Lelia Jane Sherrington
Bought by
Nutt Stephen Frederic Sherrington
Current Estimated Value
Purchase Details
Closed on
Mar 29, 1994
Sold by
Nutt George Philip
Bought by
Nutt Stephen Frederic Sherrington and Nutt Lelia Jane Sherrington
Create a Home Valuation Report for This Property
The Home Valuation Report is an in-depth analysis detailing your home's value as well as a comparison with similar homes in the area
Home Values in the Area
Average Home Value in this Area
Purchase History
| Date | Buyer | Sale Price | Title Company |
|---|---|---|---|
| Nutt Stephen Frederic Sherrington | -- | None Available | |
| Nutt Stephen Frederic Sherrington | -- | First American Title Ins Co |
Source: Public Records
Tax History Compared to Growth
Tax History
| Year | Tax Paid | Tax Assessment Tax Assessment Total Assessment is a certain percentage of the fair market value that is determined by local assessors to be the total taxable value of land and additions on the property. | Land | Improvement |
|---|---|---|---|---|
| 2024 | $3,108 | $384,486 | $102,383 | $282,103 |
| 2023 | $3,108 | $375,178 | $93,075 | $282,103 |
| 2022 | $2,425 | $342,628 | $85,000 | $257,628 |
| 2021 | $2,415 | $240,219 | $45,478 | $194,741 |
| 2020 | $2,405 | $222,422 | $42,109 | $180,313 |
| 2019 | $2,232 | $213,353 | $40,392 | $172,961 |
| 2018 | $2,112 | $191,802 | $36,312 | $155,490 |
| 2017 | $1,621 | $183,182 | $34,680 | $148,502 |
| 2016 | $1,304 | $158,740 | $34,000 | $124,740 |
| 2015 | $1,386 | $123,785 | $32,847 | $90,938 |
| 2014 | -- | $129,408 | $34,340 | $95,068 |
| 2013 | -- | $123,701 | $32,980 | $90,721 |
Source: Public Records
Map
Nearby Homes
- 25 Roosevelt Way
- 1852 Washington Dr
- 125 Park Dr
- 1931 Sanders Ct Unit 11
- 1871 Johnson Rd
- 157 Northwood Dr
- 2 Mill Rd
- 308 Mill Rd
- 1 Mill Rd
- 17 Lot Massey Way
- 1521 Roosevelt Way
- 323 Evergreen Way
- 1518 #10 Churchill Dr
- 0 3 73 Acres Derby Ave
- 8 Heather Way
- 168 Tyee Dr
- 1427 Mckenzie Way
- 158 Tyee Dr
- 2 Benson Rd
- 2132 Maple St