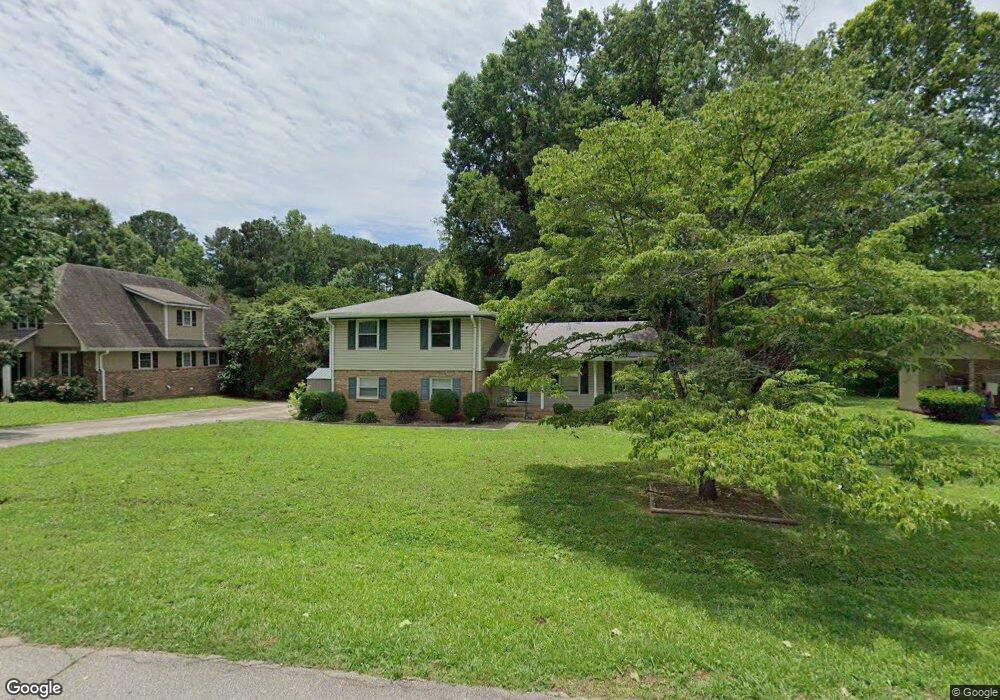
1769 Hickory St SE Conyers, GA 30013
Estimated Value: $244,213 - $284,000
3
Beds
2
Baths
2,282
Sq Ft
$114/Sq Ft
Est. Value
About This Home
This home is located at 1769 Hickory St SE, Conyers, GA 30013 and is currently estimated at $259,053, approximately $113 per square foot. 1769 Hickory St SE is a home located in Rockdale County with nearby schools including Flat Shoals Elementary School, Memorial Middle School, and Salem High School.
Ownership History
Date
Name
Owned For
Owner Type
Purchase Details
Closed on
Aug 18, 2022
Sold by
Crowne Property Acquisitions Llc
Bought by
New Residential Borrower 2022 Sfr2 Llc
Current Estimated Value
Purchase Details
Closed on
Dec 22, 2021
Sold by
Oneill Patricia
Bought by
Rls Realty Svcs Llc
Purchase Details
Closed on
Jun 13, 2016
Sold by
Joseph R
Bought by
Oneill Patricia
Purchase Details
Closed on
Mar 29, 2005
Sold by
Austin David B and Austin Twyla
Bought by
Oneill Joseph and Oneill Patricia
Home Financials for this Owner
Home Financials are based on the most recent Mortgage that was taken out on this home.
Original Mortgage
$100,000
Interest Rate
5.57%
Create a Home Valuation Report for This Property
The Home Valuation Report is an in-depth analysis detailing your home's value as well as a comparison with similar homes in the area
Home Values in the Area
Average Home Value in this Area
Purchase History
| Date | Buyer | Sale Price | Title Company |
|---|---|---|---|
| New Residential Borrower 2022 Sfr2 Llc | -- | -- | |
| Rls Realty Svcs Llc | $192,000 | -- | |
| Crowne Property Acquisitions Llc | $206,000 | -- | |
| Crowne Property Acquisitions Llc | $206,000 | -- | |
| Rls Realty Svcs Llc | $192,000 | -- | |
| Oneill Patricia | -- | -- | |
| Oneill Joseph | $125,000 | -- |
Source: Public Records
Mortgage History
| Date | Status | Borrower | Loan Amount |
|---|---|---|---|
| Previous Owner | Oneill Joseph | $100,000 |
Source: Public Records
Tax History Compared to Growth
Tax History
| Year | Tax Paid | Tax Assessment Tax Assessment Total Assessment is a certain percentage of the fair market value that is determined by local assessors to be the total taxable value of land and additions on the property. | Land | Improvement |
|---|---|---|---|---|
| 2024 | $3,684 | $92,280 | $20,800 | $71,480 |
| 2023 | $3,429 | $83,520 | $20,800 | $62,720 |
| 2022 | $2,889 | $69,920 | $18,440 | $51,480 |
| 2021 | $1,143 | $52,560 | $10,000 | $42,560 |
| 2020 | $931 | $46,040 | $8,400 | $37,640 |
| 2019 | $1,686 | $37,560 | $6,600 | $30,960 |
| 2018 | $698 | $37,560 | $6,600 | $30,960 |
| 2017 | $687 | $36,880 | $6,600 | $30,280 |
| 2016 | $396 | $28,680 | $5,120 | $23,560 |
| 2015 | $358 | $27,320 | $4,160 | $23,160 |
| 2014 | $324 | $27,320 | $4,160 | $23,160 |
| 2013 | -- | $41,360 | $10,200 | $31,160 |
Source: Public Records
Map
Nearby Homes
- 1390 White Oak St SE
- 1368 White Oak St SE Unit 2
- 1679 Oak Forest Dr SE
- 1896 Poplar St SE
- 1328 White Oak St SE
- 1260 White Oak St SE
- 1625 Old Salem Rd SE
- 1577 Salem Dr Unit 82
- 1581 Salem Dr Unit 80
- 1585 Salem Dr Unit 78
- 1575 Aiden Way Unit 38
- 1569 Aiden Way Unit 35
- 1567 Aiden Way Unit 34
- Evergreen Plan at Old Salem Crossing
- Crofton Plan at Old Salem Crossing
- Ivey Plan at Old Salem Crossing
- Holly Plan at Old Salem Crossing
- Linton Plan at Old Salem Crossing
- Hanover Plan at Old Salem Crossing
- Glen Plan at Old Salem Crossing
- 1777 Hickory St SE
- 1755 Hickory St SE
- 1770 Hickory St SE Unit 2/24
- 1770 Hickory St SE
- 1756 Hickory St SE
- 1789 Hickory St SE
- 1750 Poplar St SE
- 1784 Hickory St SE Unit II
- 1797 Hickory St SE
- 1744 Hickory St SE
- 0 Hickory St SE Unit 8230834
- 0 Hickory St SE Unit 9049798
- 1749 Poplar St SE
- 1796 Hickory St SE
- 1759 Old Salem Rd SE
- 1747 Old Salem Rd SE
- 1773 Old Salem Rd SE
- 1758 Poplar St SE Unit 2
- 1807 Hickory St SE
- 1733 Old Salem Rd SE