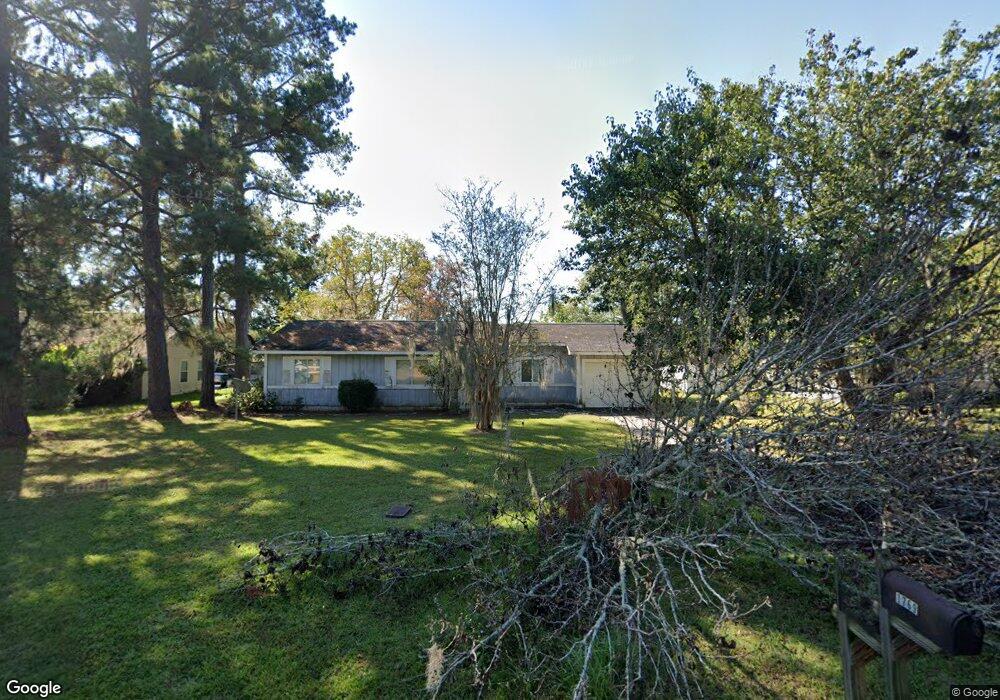
1769 Meadowood Dr Waycross, GA 31503
Estimated Value: $147,899 - $183,000
3
Beds
2
Baths
1,180
Sq Ft
$138/Sq Ft
Est. Value
About This Home
This home is located at 1769 Meadowood Dr, Waycross, GA 31503 and is currently estimated at $162,475, approximately $137 per square foot. 1769 Meadowood Dr is a home located in Ware County with nearby schools including Wacona Elementary School, Ware County Middle School, and Ware County High School.
Ownership History
Date
Name
Owned For
Owner Type
Purchase Details
Closed on
Jul 7, 2009
Sold by
Power David M
Bought by
Suntrust Mortgage Inc
Current Estimated Value
Purchase Details
Closed on
Aug 15, 2007
Sold by
Evergreen Development
Bought by
Power David M
Purchase Details
Closed on
Jun 6, 2007
Sold by
Power David M
Bought by
Evergreen Development & Cons
Purchase Details
Closed on
Apr 10, 2006
Sold by
Smith Grady E
Bought by
Power David M
Home Financials for this Owner
Home Financials are based on the most recent Mortgage that was taken out on this home.
Original Mortgage
$16,400
Interest Rate
6.29%
Mortgage Type
New Conventional
Purchase Details
Closed on
Sep 2, 2004
Sold by
Smith Ii Grady E and Smith Vickie
Bought by
Smith Ii Grady E and Smith Lori
Purchase Details
Closed on
Aug 5, 1996
Sold by
Mcpherson Betty Jane
Bought by
Smith Ii Grady E and Smith V
Purchase Details
Closed on
Apr 30, 1985
Purchase Details
Closed on
Nov 1, 1979
Create a Home Valuation Report for This Property
The Home Valuation Report is an in-depth analysis detailing your home's value as well as a comparison with similar homes in the area
Home Values in the Area
Average Home Value in this Area
Purchase History
| Date | Buyer | Sale Price | Title Company |
|---|---|---|---|
| Suntrust Mortgage Inc | $69,700 | -- | |
| Power David M | -- | -- | |
| Evergreen Development & Cons | -- | -- | |
| Power David M | $82,000 | -- | |
| Smith Ii Grady E | -- | -- | |
| Smith Ii Grady E | $53,000 | -- | |
| -- | $37,000 | -- | |
| -- | $2,000 | -- |
Source: Public Records
Mortgage History
| Date | Status | Borrower | Loan Amount |
|---|---|---|---|
| Previous Owner | Power David M | $16,400 | |
| Previous Owner | Power David M | $65,600 |
Source: Public Records
Tax History Compared to Growth
Tax History
| Year | Tax Paid | Tax Assessment Tax Assessment Total Assessment is a certain percentage of the fair market value that is determined by local assessors to be the total taxable value of land and additions on the property. | Land | Improvement |
|---|---|---|---|---|
| 2024 | $1,034 | $40,962 | $4,320 | $36,642 |
| 2023 | $1,054 | $36,035 | $1,440 | $34,595 |
| 2022 | $1,040 | $36,035 | $1,440 | $34,595 |
| 2021 | $926 | $29,521 | $1,440 | $28,081 |
| 2020 | $858 | $27,064 | $1,440 | $25,624 |
| 2019 | $896 | $27,725 | $1,440 | $26,285 |
| 2018 | $975 | $29,889 | $1,440 | $28,449 |
| 2017 | $974 | $29,889 | $1,440 | $28,449 |
| 2016 | $974 | $29,889 | $1,440 | $28,449 |
| 2015 | $984 | $29,888 | $1,440 | $28,449 |
| 2014 | $982 | $29,889 | $1,440 | $28,449 |
| 2013 | -- | $29,888 | $1,440 | $28,448 |
Source: Public Records
Map
Nearby Homes
- 1621 Meadowood Dr
- 3860 Blalock Ave
- 3648 Tanner Ln
- 123 Winn Clay Dr
- 1691 Huckaby Rd
- 3825 Jamestown Rd
- 06 Alton Cir
- 03 Alton Cir
- 02 Alton Cir
- 04 Alton Cir
- 01 Alton Cir
- 2508 Mesa Rd
- Tract 2,3 Stetson Dr
- 4190 Church Street Extension
- 0 Ash Dr
- 2885 Ben St
- 110 Briarwood Rd
- 0000 Lejune Rd
- 2879 Ben St
- 2869 Ben St
- 1739 Meadowood Dr
- 1779 Meadowood Dr
- 1729 Meadowood Dr
- 1789 Meadowood Dr
- 3635 Tanner Ln
- 1760 Meadowood Dr
- 3623 Tanner Ln
- 1784 Meadowood Dr
- 1720 Meadowood Dr
- 3606 Tanner Ln
- 1715 Meadowood Dr
- 1780 Meadowood Dr
- 3607 Tanner Ln
- 3625 Tanner Ln
- Lot 5 Tanner Ln
- Lot 4 Tanner Ln
- 000 Tanner Ln
- 000 Tanner Ln
- 0 Tanner Ln
- 0 Tanner Ln