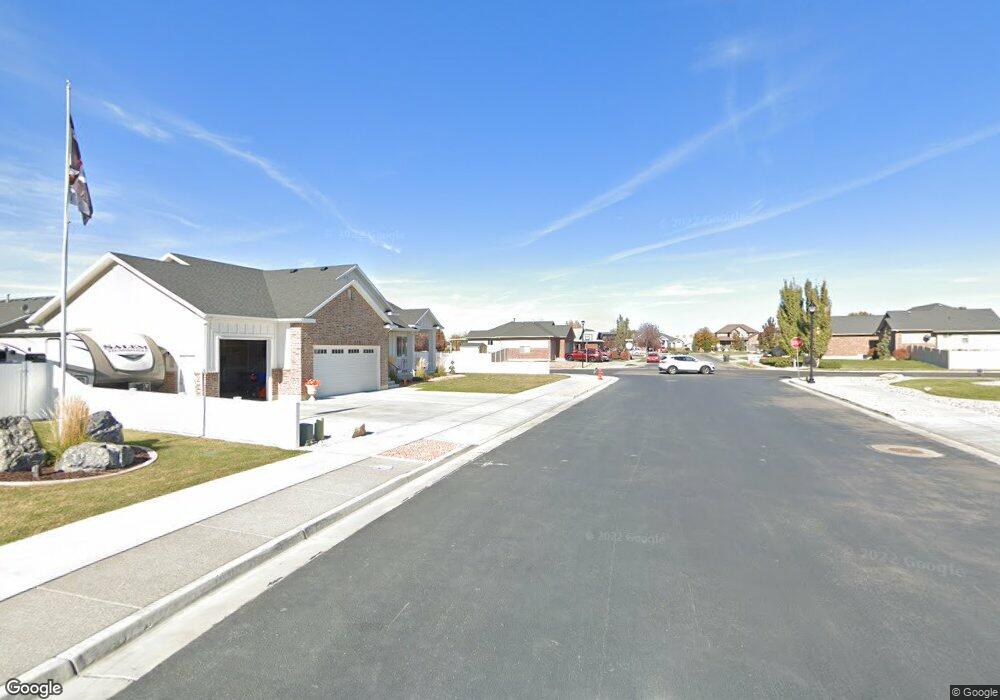
1769 N 2900 W Unit 2 Clearfield, UT 84015
Estimated Value: $369,000 - $477,000
4
Beds
2
Baths
1,800
Sq Ft
$233/Sq Ft
Est. Value
About This Home
This home is located at 1769 N 2900 W Unit 2, Clearfield, UT 84015 and is currently estimated at $418,990, approximately $232 per square foot. 1769 N 2900 W Unit 2 is a home located in Davis County with nearby schools including West Clinton Elementary School, West Point Junior High School, and Syracuse High School.
Ownership History
Date
Name
Owned For
Owner Type
Purchase Details
Closed on
May 25, 2021
Sold by
Johnson Michael G and Johnson Ruth M
Bought by
Blakeley Butler Lisa and Blakeley Taylor
Current Estimated Value
Home Financials for this Owner
Home Financials are based on the most recent Mortgage that was taken out on this home.
Original Mortgage
$333,841
Outstanding Balance
$302,070
Interest Rate
3%
Mortgage Type
FHA
Estimated Equity
$116,920
Purchase Details
Closed on
May 24, 2004
Sold by
Johnson Curtis and Johnson Jodi B
Bought by
Boglin Carlos D
Purchase Details
Closed on
May 10, 2002
Sold by
Johnson Patti J
Bought by
Johnson Curtis and Johnson Jodi B
Home Financials for this Owner
Home Financials are based on the most recent Mortgage that was taken out on this home.
Original Mortgage
$98,445
Interest Rate
7.18%
Mortgage Type
FHA
Create a Home Valuation Report for This Property
The Home Valuation Report is an in-depth analysis detailing your home's value as well as a comparison with similar homes in the area
Home Values in the Area
Average Home Value in this Area
Purchase History
| Date | Buyer | Sale Price | Title Company |
|---|---|---|---|
| Blakeley Butler Lisa | -- | Stewart Title Ins Age | |
| Boglin Carlos D | -- | Heritage West Title Insuranc | |
| Johnson Curtis | -- | Inwest Title Services Inc |
Source: Public Records
Mortgage History
| Date | Status | Borrower | Loan Amount |
|---|---|---|---|
| Open | Blakeley Butler Lisa | $333,841 | |
| Previous Owner | Johnson Curtis | $98,445 | |
| Closed | Johnson Curtis | $3,938 |
Source: Public Records
Tax History Compared to Growth
Tax History
| Year | Tax Paid | Tax Assessment Tax Assessment Total Assessment is a certain percentage of the fair market value that is determined by local assessors to be the total taxable value of land and additions on the property. | Land | Improvement |
|---|---|---|---|---|
| 2025 | $1,962 | $188,650 | $86,993 | $101,657 |
| 2024 | $1,918 | $185,350 | $95,964 | $89,386 |
| 2023 | $1,756 | $314,000 | $108,586 | $205,414 |
| 2022 | $1,868 | $184,800 | $67,156 | $117,644 |
| 2021 | $1,731 | $254,000 | $82,833 | $171,167 |
| 2020 | $1,501 | $218,000 | $69,736 | $148,264 |
| 2019 | $1,459 | $207,000 | $82,697 | $124,303 |
| 2018 | $1,306 | $182,000 | $70,008 | $111,992 |
| 2016 | $1,134 | $81,620 | $27,124 | $54,496 |
| 2015 | $1,095 | $74,965 | $27,124 | $47,841 |
| 2014 | $1,002 | $69,662 | $27,124 | $42,538 |
| 2013 | -- | $71,338 | $25,230 | $46,108 |
Source: Public Records
Map
Nearby Homes
- 3941 W 1800 N
- 1958 N 2750 W
- 2642 W 1500 N
- 2921 W 1300 N
- 2413 N Eurasian Crane Rd
- 3168 W 1300 N
- 1509 N 2475 W
- 1449 N 2475 W
- 1458 N 2400 W
- 1251 N 2525 W
- Harvard Plan at Summerfield - Enclave
- 2208 W 2615 N
- Linden Plan at Summerfield - Vista
- Yale Plan at Summerfield - Enclave
- Gambel Oak Plan at Summerfield - Vista
- Cedar Plan at Summerfield - Vista
- Elm Plan at Summerfield - Vista
- Princeton Plan at Summerfield - Enclave
- Cambridge Plan at Summerfield - Enclave
- Cornell Plan at Summerfield - Enclave