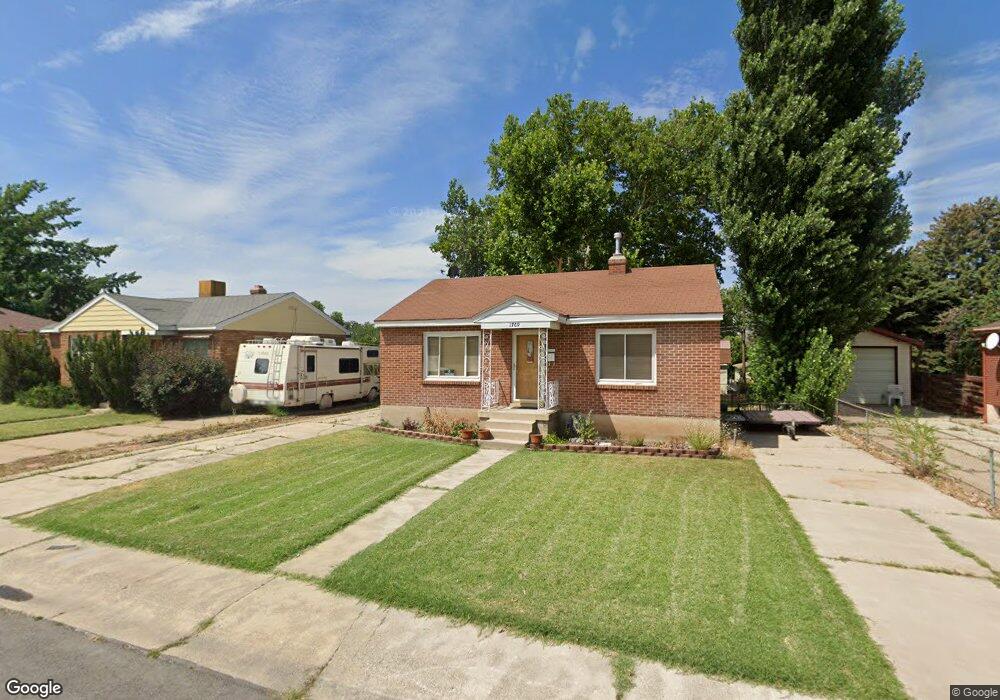
1769 N 300 W Sunset, UT 84015
Estimated Value: $339,000 - $385,390
4
Beds
2
Baths
1,684
Sq Ft
$218/Sq Ft
Est. Value
About This Home
This home is located at 1769 N 300 W, Sunset, UT 84015 and is currently estimated at $366,463, approximately $217 per square foot. 1769 N 300 W is a home located in Davis County with nearby schools including Sunset School, Sunset Junior High School, and Northridge High School.
Ownership History
Date
Name
Owned For
Owner Type
Purchase Details
Closed on
May 19, 2009
Sold by
Haller Chris
Bought by
Pyper Dustin P
Current Estimated Value
Home Financials for this Owner
Home Financials are based on the most recent Mortgage that was taken out on this home.
Original Mortgage
$141,391
Interest Rate
4.8%
Mortgage Type
FHA
Purchase Details
Closed on
Jan 18, 2007
Sold by
Peterson Kim M and Peterson Tresa
Bought by
Haller Chris
Home Financials for this Owner
Home Financials are based on the most recent Mortgage that was taken out on this home.
Original Mortgage
$137,968
Interest Rate
6.11%
Mortgage Type
Commercial
Purchase Details
Closed on
May 28, 1998
Sold by
Sartor Steven Frank
Bought by
Peterson Kim M and Peterson Tresa
Home Financials for this Owner
Home Financials are based on the most recent Mortgage that was taken out on this home.
Original Mortgage
$97,200
Interest Rate
7.13%
Mortgage Type
Commercial
Create a Home Valuation Report for This Property
The Home Valuation Report is an in-depth analysis detailing your home's value as well as a comparison with similar homes in the area
Home Values in the Area
Average Home Value in this Area
Purchase History
| Date | Buyer | Sale Price | Title Company |
|---|---|---|---|
| Pyper Dustin P | -- | First American Title | |
| Haller Chris | -- | None Available | |
| Peterson Kim M | -- | Backman Stewart Title Servic |
Source: Public Records
Mortgage History
| Date | Status | Borrower | Loan Amount |
|---|---|---|---|
| Previous Owner | Pyper Dustin P | $141,391 | |
| Previous Owner | Pyper Dustin P | $4,873 | |
| Previous Owner | Haller Chris | $137,968 | |
| Previous Owner | Peterson Kim M | $97,200 |
Source: Public Records
Tax History Compared to Growth
Tax History
| Year | Tax Paid | Tax Assessment Tax Assessment Total Assessment is a certain percentage of the fair market value that is determined by local assessors to be the total taxable value of land and additions on the property. | Land | Improvement |
|---|---|---|---|---|
| 2025 | $2,141 | $195,250 | $70,135 | $125,115 |
| 2024 | $2,074 | $189,199 | $67,067 | $122,132 |
| 2023 | $1,948 | $178,200 | $59,148 | $119,051 |
| 2022 | $2,077 | $340,000 | $112,543 | $227,457 |
| 2021 | $1,830 | $259,000 | $64,587 | $194,413 |
| 2020 | $1,480 | $206,000 | $54,111 | $151,889 |
| 2019 | $1,408 | $201,000 | $72,203 | $128,797 |
| 2018 | $1,245 | $174,000 | $57,701 | $116,299 |
| 2016 | $1,076 | $77,220 | $27,267 | $49,953 |
| 2015 | $1,034 | $70,345 | $27,030 | $43,315 |
| 2014 | $1,023 | $71,105 | $27,352 | $43,753 |
| 2013 | -- | $72,437 | $23,265 | $49,172 |
Source: Public Records
Map
Nearby Homes
- 1783 N 300 W
- 1747 N 400 W
- 1721 N 400 W
- 36 W 1600 N
- 1746 N 475 W
- 1623 N 400 W
- 296 W 1550 N
- 1822 N 75 W
- 1647 N Main St
- 31 W 1600 N
- 1443 N 200 W
- 312 W 1425 N
- 2129 N 250 W
- 2085 N Main St Unit 409
- 2085 N Main St Unit 108
- 2085 N Main St Unit 401
- 2085 N Main St Unit 308
- 2085 N Main St Unit 116
- 2085 N Main St Unit 201
- 2085 N Main St Unit 402