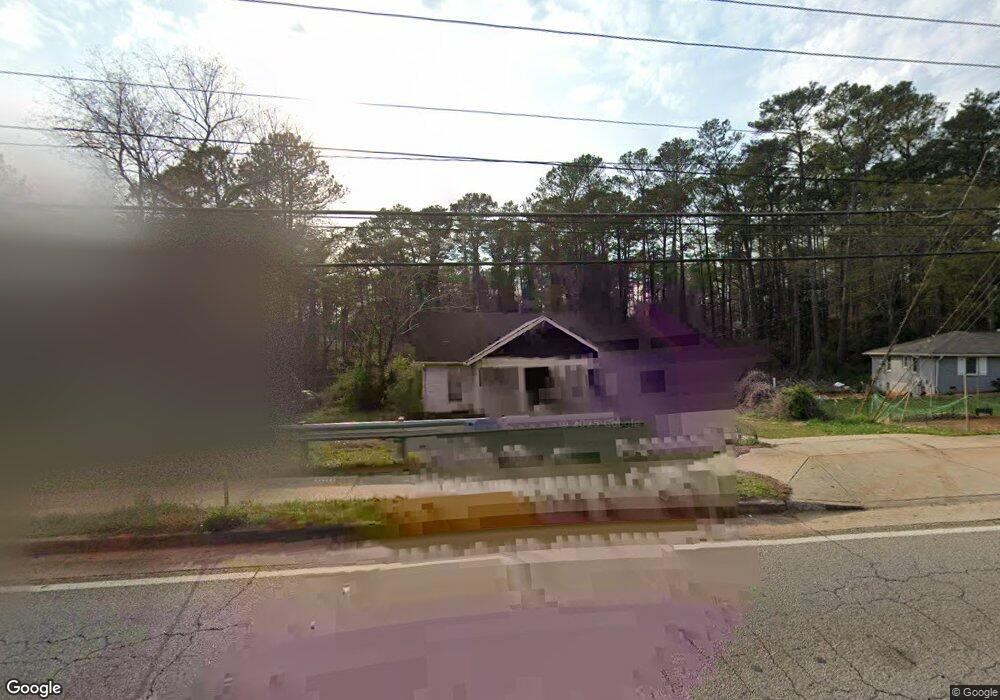
1769 S Hairston Rd Stone Mountain, GA 30088
Estimated Value: $200,000 - $235,000
2
Beds
2
Baths
1,764
Sq Ft
$125/Sq Ft
Est. Value
About This Home
This home is located at 1769 S Hairston Rd, Stone Mountain, GA 30088 and is currently estimated at $220,825, approximately $125 per square foot. 1769 S Hairston Rd is a home located in DeKalb County with nearby schools including Woodridge Elementary School, Miller Grove Middle School, and Miller Grove High School.
Ownership History
Date
Name
Owned For
Owner Type
Purchase Details
Closed on
Nov 26, 2008
Sold by
Home Eqty Ln Trust 2004-He3
Bought by
Franklin Daren J
Current Estimated Value
Purchase Details
Closed on
Apr 1, 2008
Sold by
Alexander Wimbley
Bought by
Home Equity Ln Trust 2004-He3
Purchase Details
Closed on
Jun 24, 2002
Sold by
Brathwaite Patrick and Brathwaite Alison J
Bought by
Alexander Wimbley
Home Financials for this Owner
Home Financials are based on the most recent Mortgage that was taken out on this home.
Original Mortgage
$66,400
Interest Rate
6.86%
Mortgage Type
New Conventional
Purchase Details
Closed on
Aug 8, 1997
Sold by
Purcell Claude Y
Bought by
Brathwaite Patrick
Home Financials for this Owner
Home Financials are based on the most recent Mortgage that was taken out on this home.
Original Mortgage
$40,000
Interest Rate
9.74%
Mortgage Type
New Conventional
Create a Home Valuation Report for This Property
The Home Valuation Report is an in-depth analysis detailing your home's value as well as a comparison with similar homes in the area
Home Values in the Area
Average Home Value in this Area
Purchase History
| Date | Buyer | Sale Price | Title Company |
|---|---|---|---|
| Franklin Daren J | $13,200 | -- | |
| Home Equity Ln Trust 2004-He3 | $56,000 | -- | |
| Alexander Wimbley | $83,000 | -- | |
| Brathwaite Patrick | $50,000 | -- |
Source: Public Records
Mortgage History
| Date | Status | Borrower | Loan Amount |
|---|---|---|---|
| Previous Owner | Alexander Wimbley | $66,400 | |
| Previous Owner | Brathwaite Patrick | $40,000 |
Source: Public Records
Tax History Compared to Growth
Tax History
| Year | Tax Paid | Tax Assessment Tax Assessment Total Assessment is a certain percentage of the fair market value that is determined by local assessors to be the total taxable value of land and additions on the property. | Land | Improvement |
|---|---|---|---|---|
| 2024 | $3,845 | $78,320 | $9,000 | $69,320 |
| 2023 | $3,845 | $64,200 | $9,000 | $55,200 |
| 2022 | $2,920 | $59,400 | $9,000 | $50,400 |
| 2021 | $1,616 | $29,680 | $2,120 | $27,560 |
| 2020 | $1,373 | $24,160 | $2,120 | $22,040 |
| 2019 | $1,180 | $19,760 | $2,120 | $17,640 |
| 2018 | $865 | $13,240 | $2,120 | $11,120 |
| 2017 | $853 | $9,880 | $2,120 | $7,760 |
| 2016 | $787 | $10,720 | $2,120 | $8,600 |
| 2014 | $491 | $3,920 | $2,000 | $1,920 |
Source: Public Records
Map
Nearby Homes
- 4059 Big Valley Trail
- 4032 Big Valley Trail
- 4105 Cedar Ridge Trail
- 4690 Big Valley Ct
- 1775 Canberra Dr
- 1764 Big Valley Way Unit 3
- 4665 Big Valley Rd
- 1586 Elm Ridge Way
- 4756 Manly Ct
- 4623 Birch Ridge Trail
- 4818 Terrace Green Trace Unit D
- 4669 Birch Ridge Trail
- 1574 S Hairston Rd
- 1923 Manhattan Pkwy Unit 183
- 1651 Links Overlook
- 4564 Cypress Ridge Ct Unit 4
- 1513 Spruce Ridge Way
- 4550 Cypress Ridge Ct
- 4829 Woodhurst Way
- 4317 Cedar Ridge Trail
- 1745 S Hairston Rd
- 1763 S Hairston Rd
- 1763 S Hairston Rd Unit 1763
- 2370 S Hairston Rd
- S S Hairston Rd Unit 36
- 2546 S Hairston Rd
- S S Hairston Rd
- 1762 S Hairston Rd
- 1754 S Hairston Rd
- 4067 Big Valley Trail
- 4075 Big Valley Trail
- 1770 S Hairston Rd
- 1727 S Hairston Rd
- 4051 Big Valley Trail
- 1779 S Hairston Rd Unit 2
- 4083 Big Valley Trail
- 4035 Big Valley Trail
- 4043 Big Valley Trail
- 1732 S Hairston Rd
- 4780 Big Valley Rd Unit 2