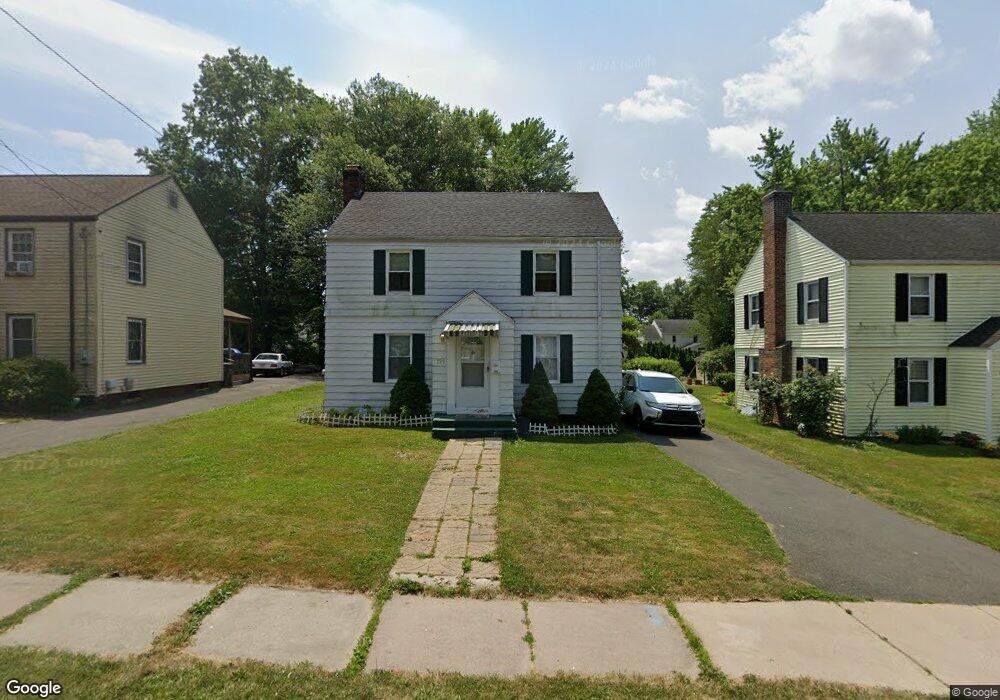
177 Andover St Hartford, CT 06112
Blue Hills NeighborhoodEstimated Value: $264,688 - $302,000
3
Beds
6
Baths
1,375
Sq Ft
$203/Sq Ft
Est. Value
About This Home
This home is located at 177 Andover St, Hartford, CT 06112 and is currently estimated at $279,172, approximately $203 per square foot. 177 Andover St is a home located in Hartford County with nearby schools including Rawson School, Breakthrough Magnet School - North Campus, and West Middle School.
Ownership History
Date
Name
Owned For
Owner Type
Purchase Details
Closed on
Feb 3, 2016
Sold by
Barrett Creshana
Bought by
Cbarrett Properties Ll
Current Estimated Value
Purchase Details
Closed on
Jul 31, 2006
Sold by
Wachovia Bk
Bought by
Barrett Creshana
Purchase Details
Closed on
Oct 4, 2004
Sold by
Nelson Mildred
Bought by
Nelson Elaine and Nelson Kevin
Create a Home Valuation Report for This Property
The Home Valuation Report is an in-depth analysis detailing your home's value as well as a comparison with similar homes in the area
Home Values in the Area
Average Home Value in this Area
Purchase History
| Date | Buyer | Sale Price | Title Company |
|---|---|---|---|
| Cbarrett Properties Ll | -- | -- | |
| Barrett Creshana | $139,000 | -- | |
| Nelson Elaine | $129,900 | -- |
Source: Public Records
Mortgage History
| Date | Status | Borrower | Loan Amount |
|---|---|---|---|
| Previous Owner | Nelson Elaine | $120,304 | |
| Previous Owner | Nelson Elaine | $25,000 | |
| Previous Owner | Nelson Elaine | $23,800 |
Source: Public Records
Tax History Compared to Growth
Tax History
| Year | Tax Paid | Tax Assessment Tax Assessment Total Assessment is a certain percentage of the fair market value that is determined by local assessors to be the total taxable value of land and additions on the property. | Land | Improvement |
|---|---|---|---|---|
| 2024 | $4,214 | $61,115 | $5,219 | $55,896 |
| 2023 | $4,214 | $61,115 | $5,219 | $55,896 |
| 2022 | $4,214 | $61,116 | $5,219 | $55,897 |
| 2021 | $3,068 | $41,300 | $6,195 | $35,105 |
| 2020 | $3,068 | $41,300 | $6,195 | $35,105 |
| 2019 | $3,068 | $41,300 | $6,195 | $35,105 |
| 2018 | $2,965 | $39,908 | $5,987 | $33,921 |
| 2016 | $3,101 | $41,744 | $5,701 | $36,043 |
| 2015 | $2,954 | $39,761 | $5,430 | $34,331 |
| 2014 | $2,882 | $38,789 | $5,297 | $33,492 |
Source: Public Records
Map
Nearby Homes
- 180 Andover St
- 179 Manchester St
- 157 Pembroke St Unit 159
- 144 Thomaston St
- 211 Holcomb St Unit 213
- 90 Manchester St
- 355 Cornwall St Unit 357
- 86 Hartland St
- 25 Cornwall St
- 111 Westbourne Pkwy Unit 113
- 152 Burnham St
- 11 Pershing St Unit 13
- 171 N Canaan St
- 165 Bloomfield Ave
- 181 Westbourne Pkwy
- 70 Burnham St Unit 72
- 109 Blue Hills Ave
- 111 Bloomfield Ave
- 103 Baltimore St
- 36 Baltic St Unit 38