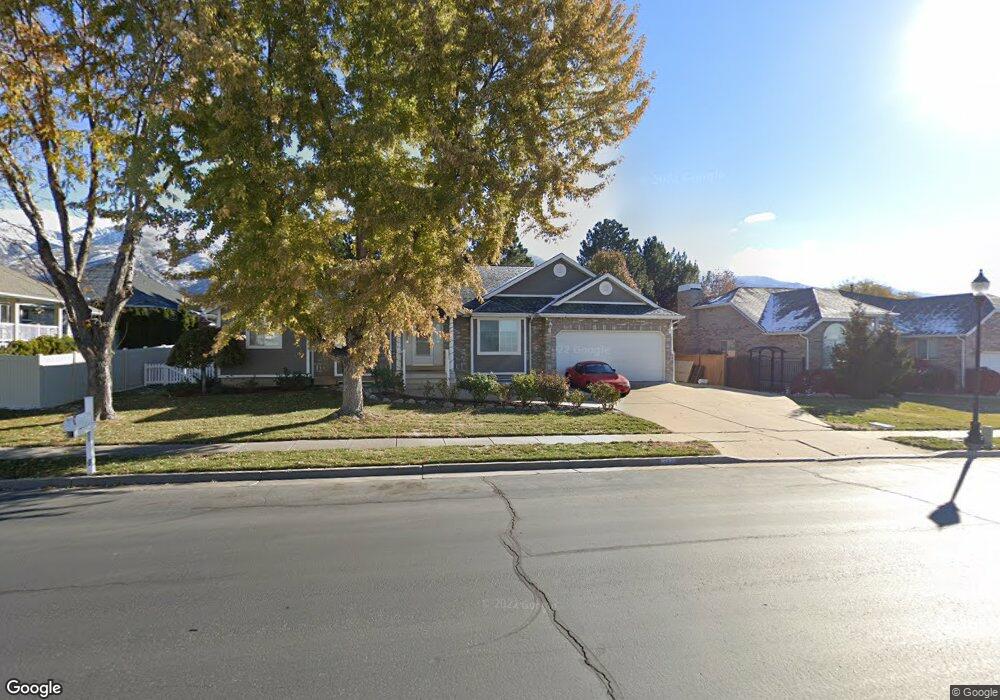
177 Boynton Rd Layton, UT 84040
Estimated Value: $590,000 - $656,000
4
Beds
3
Baths
1,716
Sq Ft
$370/Sq Ft
Est. Value
About This Home
This home is located at 177 Boynton Rd, Layton, UT 84040 and is currently estimated at $634,063, approximately $369 per square foot. 177 Boynton Rd is a home located in Davis County with nearby schools including Morgan Elementary School, Fairfield Junior High School, and Layton High School.
Ownership History
Date
Name
Owned For
Owner Type
Purchase Details
Closed on
May 10, 2005
Sold by
Bes Properties Lc
Bought by
Berrett Jan T
Current Estimated Value
Purchase Details
Closed on
May 9, 2005
Sold by
Barrett Jon I
Bought by
Barrett Beryl B
Purchase Details
Closed on
Apr 9, 2004
Sold by
Barrett Beryl B
Bought by
Bbb Properties Lc
Purchase Details
Closed on
Aug 4, 2003
Sold by
Barrett Beryl B
Bought by
Bbb Properties Lc
Purchase Details
Closed on
May 6, 1996
Sold by
Larson Christan and Larson Merinda M
Bought by
Barrett Beryl B
Create a Home Valuation Report for This Property
The Home Valuation Report is an in-depth analysis detailing your home's value as well as a comparison with similar homes in the area
Home Values in the Area
Average Home Value in this Area
Purchase History
| Date | Buyer | Sale Price | Title Company |
|---|---|---|---|
| Berrett Jan T | -- | Backman Stewart Title Servic | |
| Barrett Beryl B | -- | -- | |
| Bbb Properties Lc | -- | -- | |
| Bbb Properties Lc | -- | -- | |
| Barrett Beryl B | -- | Mountain View Title |
Source: Public Records
Tax History Compared to Growth
Tax History
| Year | Tax Paid | Tax Assessment Tax Assessment Total Assessment is a certain percentage of the fair market value that is determined by local assessors to be the total taxable value of land and additions on the property. | Land | Improvement |
|---|---|---|---|---|
| 2025 | $3,261 | $319,000 | $123,792 | $195,208 |
| 2024 | $2,915 | $287,650 | $147,746 | $139,904 |
| 2023 | $2,964 | $521,000 | $199,490 | $321,510 |
| 2022 | $3,103 | $298,100 | $106,981 | $191,119 |
| 2021 | $2,838 | $406,000 | $162,775 | $243,225 |
| 2020 | $2,611 | $358,000 | $131,643 | $226,357 |
| 2019 | $2,541 | $343,000 | $117,631 | $225,369 |
| 2018 | $2,334 | $317,000 | $91,447 | $225,553 |
| 2016 | $2,255 | $160,215 | $48,158 | $112,057 |
| 2015 | $2,089 | $141,240 | $48,158 | $93,082 |
| 2014 | $2,161 | $150,345 | $48,158 | $102,187 |
| 2013 | -- | $139,870 | $34,135 | $105,735 |
Source: Public Records
Map
Nearby Homes
- 308 N 1800 E
- 250 E 950 N
- 2382 Summerwood Dr
- 1336 E Maple Way
- 2603 Summerwood Dr
- 1515 E Gentile St
- 2877 E Gentile St Unit 2
- 1168 Holmes Creek Ln
- 1060 N Kingswood Rd
- 890 E Brookshire Dr
- 664 N 300 E
- 1247 E 300 N
- 257 E 600 N
- 378 N Thurston Ln
- 1503 E 530 N
- 479 N 1375 E
- 685 S Pheasant View Dr
- 285 E 500 N Unit 102
- 1306 N Thornfield Rd
- 953 E 100 S
- 181 Boynton Rd
- 1902 E 125 S
- 182 S 1950 E
- 1910 E 125 S
- 170 Boynton Rd
- 189 Boynton Rd
- 190 S 1950 E
- 156 Boynton Rd
- 1928 E 125 S
- 1848 E Maple Way Unit 510
- 179 S 1950 E
- 124 Boynton Rd
- 197 Boynton Rd
- 198 S 1950 E
- 1911 E 125 S
- 197 Boynton Rd
- 1836 E Maple Way Unit 509
- 1750 E 125 S Unit 530
- 187 S 1950 E
- 157 S 1800 E Unit 519