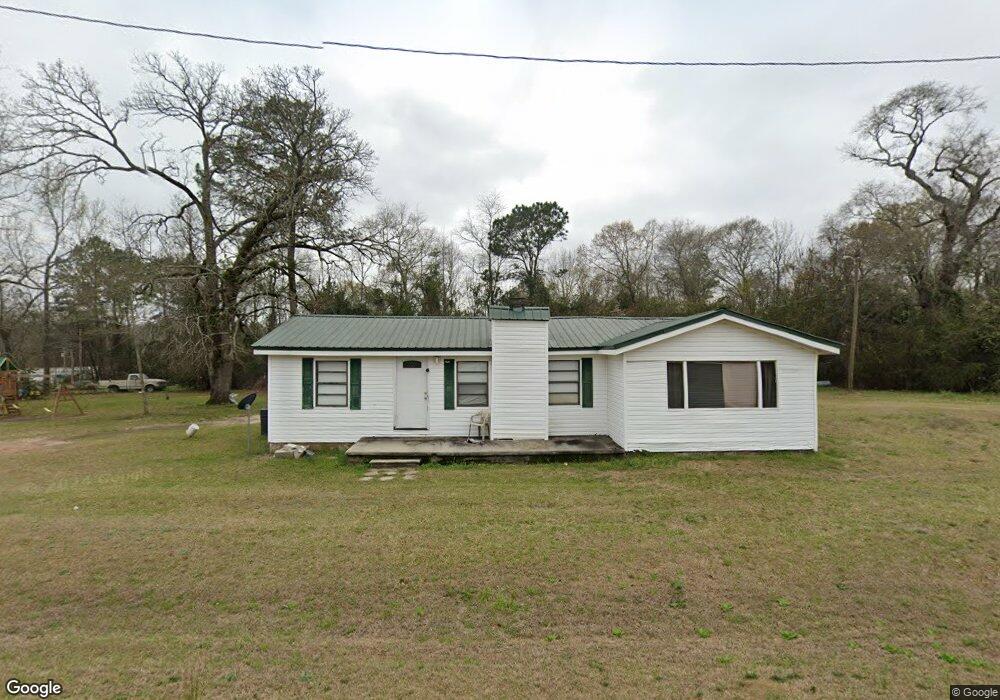
177 Churchwell Rd Cochran, GA 31014
Estimated Value: $107,000 - $176,000
3
Beds
2
Baths
1,248
Sq Ft
$113/Sq Ft
Est. Value
About This Home
This home is located at 177 Churchwell Rd, Cochran, GA 31014 and is currently estimated at $141,065, approximately $113 per square foot. 177 Churchwell Rd is a home located in Bleckley County with nearby schools including Bleckley County Primary School, Bleckley County Elementary School, and Bleckley Middle School.
Ownership History
Date
Name
Owned For
Owner Type
Purchase Details
Closed on
Feb 27, 2017
Sold by
Camera Bryan D
Bought by
Williams Stevie and Williams Patricia A
Current Estimated Value
Purchase Details
Closed on
Oct 28, 2009
Sold by
Camera Brian D
Bought by
Marshall Shirley J
Purchase Details
Closed on
Jul 10, 2006
Sold by
Lasalle National Bank
Bought by
Camera Bryan D
Purchase Details
Closed on
Jan 3, 2006
Sold by
Reynolds Talmadge Eugene and Reynolds Sh
Bought by
Lasalle Bank National Association As
Purchase Details
Closed on
Apr 9, 2004
Sold by
Carey Sheila I
Bought by
Reynolds Talmadge Eugene and Reynolds Sheila
Purchase Details
Closed on
Mar 28, 1997
Sold by
Carey Wayne
Bought by
Carey Sheila I
Purchase Details
Closed on
Feb 10, 1987
Bought by
Carey Wayne
Purchase Details
Closed on
Jul 25, 1986
Bought by
Carey Wayne
Create a Home Valuation Report for This Property
The Home Valuation Report is an in-depth analysis detailing your home's value as well as a comparison with similar homes in the area
Home Values in the Area
Average Home Value in this Area
Purchase History
| Date | Buyer | Sale Price | Title Company |
|---|---|---|---|
| Williams Stevie | $53,000 | -- | |
| Marshall Shirley J | -- | -- | |
| Camera Bryan D | $24,500 | -- | |
| Lasalle Bank National Association As | $34,000 | -- | |
| Reynolds Talmadge Eugene | -- | -- | |
| Carey Sheila I | $14,700 | -- | |
| Carey Wayne | -- | -- | |
| Carey Wayne | -- | -- |
Source: Public Records
Tax History Compared to Growth
Tax History
| Year | Tax Paid | Tax Assessment Tax Assessment Total Assessment is a certain percentage of the fair market value that is determined by local assessors to be the total taxable value of land and additions on the property. | Land | Improvement |
|---|---|---|---|---|
| 2024 | $1,228 | $45,920 | $2,120 | $43,800 |
| 2023 | $1,228 | $45,920 | $2,120 | $43,800 |
| 2022 | $1,135 | $41,720 | $2,120 | $39,600 |
| 2021 | $977 | $33,560 | $1,680 | $31,880 |
| 2020 | $977 | $33,560 | $1,680 | $31,880 |
| 2019 | $645 | $22,121 | $1,824 | $20,297 |
| 2018 | $651 | $22,121 | $1,824 | $20,297 |
| 2017 | $650 | $22,121 | $1,824 | $20,297 |
| 2016 | $651 | $22,121 | $1,824 | $20,297 |
| 2015 | -- | $22,121 | $1,824 | $20,297 |
| 2014 | -- | $22,121 | $1,824 | $20,297 |
| 2013 | -- | $22,120 | $1,824 | $20,296 |
Source: Public Records
Map
Nearby Homes
- 156 Churchwell Rd
- 0 Churchwell Rd Unit 255785
- 0 Churchwell Rd Unit 24917742
- 0 Jones Rd
- 178 Country Club Cir
- 319 Country Club Rd
- 0 Hudson Jones Rd Unit 10510230
- 0 Hudson Jones Rd Unit 22809864
- 0 Lucas Rd
- 123 Bowman Drive Rd
- 121 Bowman Dr
- 123 Bowman Dr
- 110 Chestnut Dr
- 10 Timber Way
- 7 Evergreen Dr
- 140 Rene Ln
- 0 Rock Hill Rd
- 118 Laurel Dr
- 166 Pebble Hills Rd
- 264 Ann St
- 379 Spoonbill Rd
- 166 Churchwell Rd
- 158 Churchwell Rd
- 193 Churchwell Rd
- 197 Churchwell Rd
- 0 Churchwell Rd Unit 3121773
- 0 Churchwell Rd
- 138 Churchwell Rd
- 209 Churchwell Rd
- 214 Churchwell Rd
- 133 Churchwell Rd
- 219 Churchwell Rd
- 991 Ga Highway 26 E
- 127 Churchwell Rd
- 222 Churchwell Rd
- 233 Churchwell Rd
- 975 Ga Highway 26 E
- 240 Churchwell Rd
- 113 Churchwell Rd
- 128 Flat Creek Ln