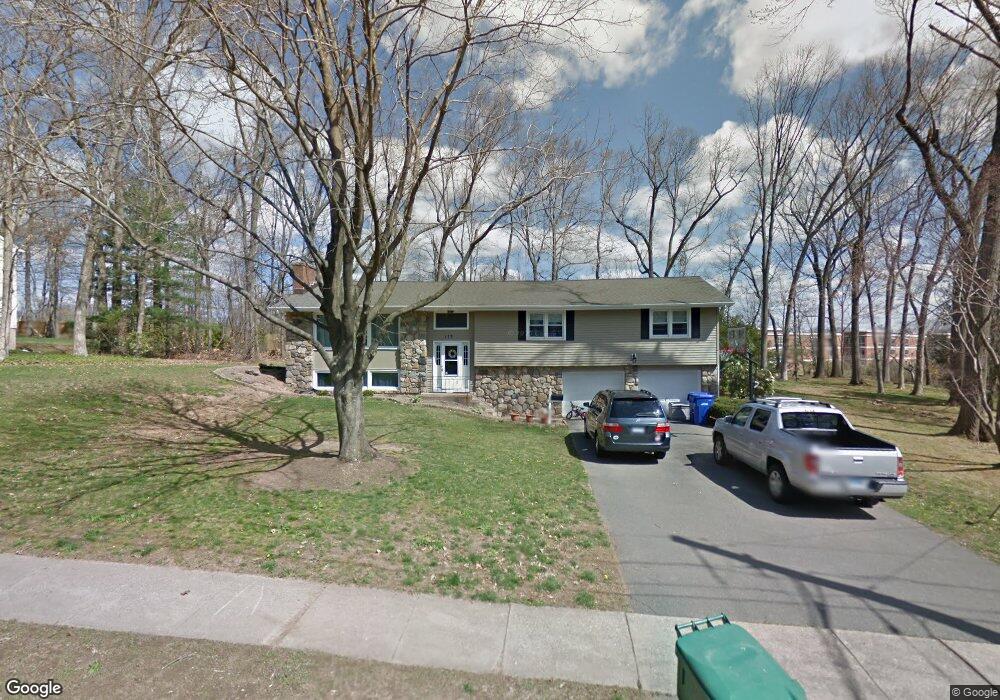
177 Clinton Dr South Windsor, CT 06074
Estimated Value: $497,000 - $537,000
3
Beds
3
Baths
1,594
Sq Ft
$321/Sq Ft
Est. Value
About This Home
This home is located at 177 Clinton Dr, South Windsor, CT 06074 and is currently estimated at $512,155, approximately $321 per square foot. 177 Clinton Dr is a home located in Hartford County with nearby schools including Timothy Edwards School, South Windsor High School, and St Bridget School.
Ownership History
Date
Name
Owned For
Owner Type
Purchase Details
Closed on
Mar 26, 2010
Sold by
Garvey Leigh
Bought by
Garvey David and Garvey Leigh
Current Estimated Value
Purchase Details
Closed on
Jul 17, 2007
Sold by
Manhertz Nigel
Bought by
Garvey David and Garvey Leigh
Home Financials for this Owner
Home Financials are based on the most recent Mortgage that was taken out on this home.
Original Mortgage
$200,000
Interest Rate
6.48%
Purchase Details
Closed on
Mar 27, 2000
Sold by
Yacovone Donald
Bought by
Manhertz Nigel and Manhertz Angella
Create a Home Valuation Report for This Property
The Home Valuation Report is an in-depth analysis detailing your home's value as well as a comparison with similar homes in the area
Home Values in the Area
Average Home Value in this Area
Purchase History
| Date | Buyer | Sale Price | Title Company |
|---|---|---|---|
| Garvey David | -- | -- | |
| Garvey David | $300,000 | -- | |
| Manhertz Nigel | $185,000 | -- |
Source: Public Records
Mortgage History
| Date | Status | Borrower | Loan Amount |
|---|---|---|---|
| Closed | Manhertz Nigel | $30,000 | |
| Previous Owner | Manhertz Nigel | $200,000 | |
| Previous Owner | Manhertz Nigel | $179,950 | |
| Previous Owner | Manhertz Nigel | $179,950 |
Source: Public Records
Tax History Compared to Growth
Tax History
| Year | Tax Paid | Tax Assessment Tax Assessment Total Assessment is a certain percentage of the fair market value that is determined by local assessors to be the total taxable value of land and additions on the property. | Land | Improvement |
|---|---|---|---|---|
| 2024 | $8,543 | $247,900 | $106,100 | $141,800 |
| 2023 | $8,215 | $247,900 | $106,100 | $141,800 |
| 2022 | $7,223 | $186,300 | $99,700 | $86,600 |
| 2021 | $7,053 | $186,300 | $99,700 | $86,600 |
| 2020 | $7,057 | $186,300 | $99,700 | $86,600 |
| 2019 | $7,173 | $186,300 | $99,700 | $86,600 |
| 2018 | $7,018 | $186,300 | $99,700 | $86,600 |
| 2017 | $6,626 | $174,000 | $96,600 | $77,400 |
| 2016 | $6,497 | $174,000 | $96,600 | $77,400 |
| 2015 | $6,358 | $174,000 | $96,600 | $77,400 |
| 2014 | $6,179 | $174,000 | $96,600 | $77,400 |
Source: Public Records
Map
Nearby Homes