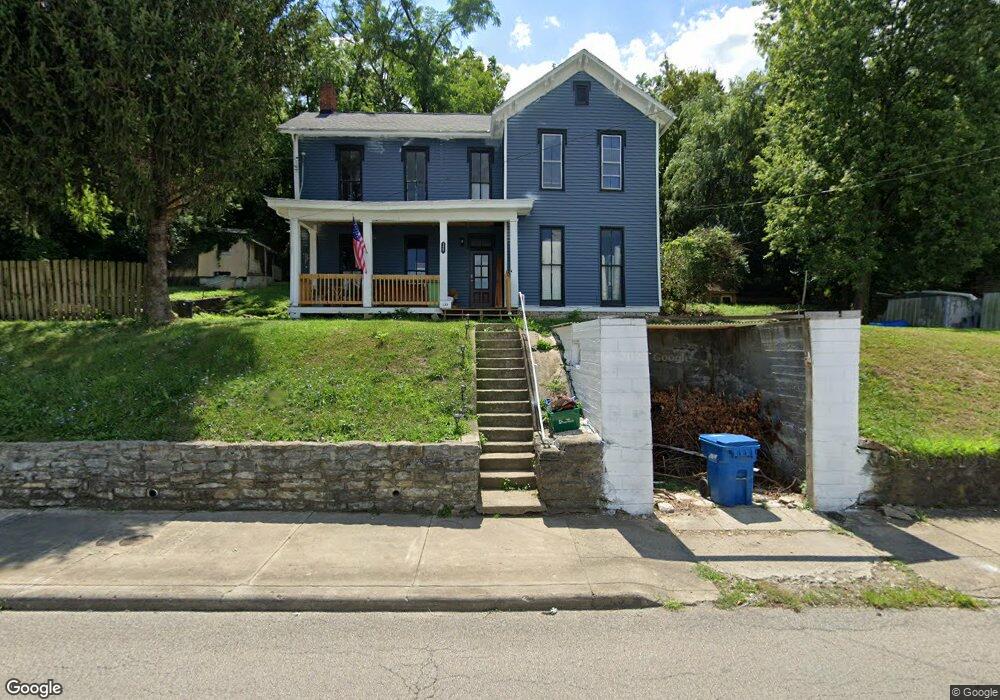
177 Conwell St Aurora, IN 47001
Estimated Value: $137,000 - $179,000
3
Beds
1
Bath
1,996
Sq Ft
$79/Sq Ft
Est. Value
About This Home
This home is located at 177 Conwell St, Aurora, IN 47001 and is currently estimated at $158,335, approximately $79 per square foot. 177 Conwell St is a home located in Dearborn County with nearby schools including Aurora Elementary School, South Dearborn Middle School, and South Dearborn High School.
Ownership History
Date
Name
Owned For
Owner Type
Purchase Details
Closed on
Jul 18, 2023
Sold by
Wallace Anthony and Wallace Cara
Bought by
Alexander-Starkweather Susan and Dudley James R
Current Estimated Value
Home Financials for this Owner
Home Financials are based on the most recent Mortgage that was taken out on this home.
Original Mortgage
$117,826
Outstanding Balance
$114,703
Interest Rate
7.25%
Mortgage Type
FHA
Estimated Equity
$43,632
Purchase Details
Closed on
Apr 29, 2022
Sold by
Ingram Ryan and Ingram Amber
Bought by
Wallace Anthony and Wallace Cara
Purchase Details
Closed on
Jul 15, 2015
Sold by
Smith Joab M and Smith Ruth H
Bought by
Ingram James and Ingram Brenda
Purchase Details
Closed on
Feb 26, 2015
Sold by
Cr Homes Llc
Bought by
Smith Joab M and Smith Ruth H
Purchase Details
Closed on
Dec 18, 2014
Sold by
Fannie Mae
Bought by
Cr Homes Llc
Purchase Details
Closed on
May 28, 2014
Sold by
Ann Ann
Bought by
Federal National Mortgage Association and Fannie Mae
Create a Home Valuation Report for This Property
The Home Valuation Report is an in-depth analysis detailing your home's value as well as a comparison with similar homes in the area
Home Values in the Area
Average Home Value in this Area
Purchase History
| Date | Buyer | Sale Price | Title Company |
|---|---|---|---|
| Alexander-Starkweather Susan | $120,000 | None Listed On Document | |
| Wallace Anthony | -- | Ewan Andrea S | |
| Ingram James | -- | American Title Services | |
| Smith Joab M | $11,250 | None Available | |
| Cr Homes Llc | $3,050 | Attorney | |
| Federal National Mortgage Association | -- | -- |
Source: Public Records
Mortgage History
| Date | Status | Borrower | Loan Amount |
|---|---|---|---|
| Open | Alexander-Starkweather Susan | $117,826 |
Source: Public Records
Tax History
| Year | Tax Paid | Tax Assessment Tax Assessment Total Assessment is a certain percentage of the fair market value that is determined by local assessors to be the total taxable value of land and additions on the property. | Land | Improvement |
|---|---|---|---|---|
| 2025 | $570 | $67,800 | $8,100 | $59,700 |
| 2024 | $570 | $65,700 | $8,100 | $57,600 |
| 2023 | $508 | $61,300 | $8,100 | $53,200 |
| 2022 | $489 | $56,800 | $8,100 | $48,700 |
| 2021 | $453 | $52,600 | $8,100 | $44,500 |
| 2020 | $436 | $52,600 | $8,100 | $44,500 |
| 2019 | $405 | $49,100 | $8,100 | $41,000 |
| 2018 | $406 | $49,100 | $8,100 | $41,000 |
| 2017 | $399 | $47,600 | $8,100 | $39,500 |
| 2016 | $386 | $47,600 | $8,100 | $39,500 |
| 2014 | $377 | $62,600 | $8,100 | $54,500 |
| 2013 | $377 | $73,200 | $8,100 | $65,100 |
Source: Public Records
Map
Nearby Homes
- 148 W 4th St
- 12431 Siemantel Ave
- 178 W 4th St
- 110 W Conwell St
- 129 W Conwell St
- 0 Indiana 350
- 205 Hanover Ave
- 109 Grant St
- 4727 Tall Oak Dr
- 0-76 Indian Ridge Dr
- 0-37 Indian Ridge Dr
- 0-78 Indian Ridge Dr
- 0-82 Indian Ridge Dr
- 0-75 Indian Ridge Dr
- 0-35 Indian Ridge Dr
- 0-77 Indian Ridge Dr
- 109 5th St
- 0-0 Green Blvd
- 0-46 Falling Rock Dr
- 0-48 Falling Rock Dr
- 177 Conwell St
- 173 Conwell St
- 181 Conwell St
- 171 Conwell St
- 183 Conwell St
- 169 Conwell St
- 185 Conwell St
- 170 Conwell St
- 164 Conwell St
- 101 Lincoln St Unit 103
- 101 Lincoln St Unit 1.2
- 163 Conwell St
- 162 Conwell St
- 162 Conwell St Unit 3
- 161 Conwell St
- 160 Conwell St
- 109 Lincoln St
- 158 Conwell St
- 202 Conwell St
- 155 Conwell St
Your Personal Tour Guide
Ask me questions while you tour the home.