Estimated Value: $292,000 - $530,000
--
Bed
--
Bath
2,080
Sq Ft
$180/Sq Ft
Est. Value
About This Home
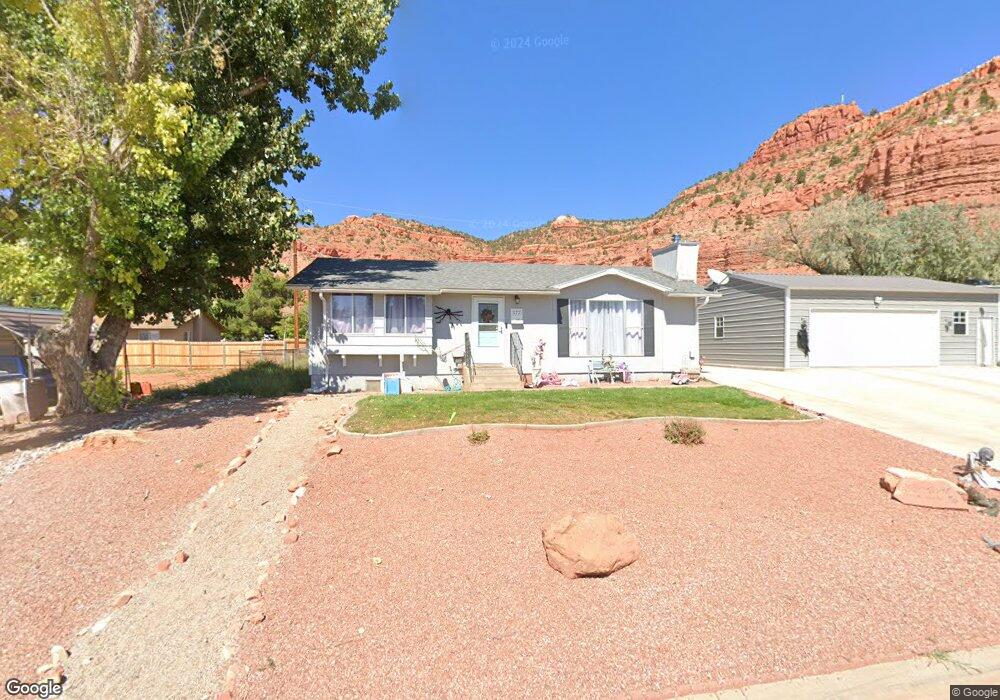
This home is located at 177 E 450 N, Kanab, UT 84741 and is currently estimated at $373,776, approximately $179 per square foot. 177 E 450 N is a home located in Kane County with nearby schools including Kanab Elementary School, Kanab Middle School, and Kanab High School.
Ownership History
Date
Name
Owned For
Owner Type
Purchase Details
Closed on
Aug 20, 2014
Sold by
Thomas Landon Thomas Landon
Bought by
Cram Thomas Landon and Cram Tiffany
Current Estimated Value
Purchase Details
Closed on
Aug 8, 2013
Sold by
Roundy Norman and Roundy Nancy K M
Bought by
Cram Thomas Landon
Home Financials for this Owner
Home Financials are based on the most recent Mortgage that was taken out on this home.
Original Mortgage
$103,000
Interest Rate
4.51%
Purchase Details
Closed on
Jun 26, 2009
Sold by
Sun Mountain Lc
Bought by
Roundy Norman and Roundy Nancy K M
Purchase Details
Closed on
Aug 7, 2007
Sold by
Roundy Nancy K M
Bought by
Roundy Norman and Roundy Nancy K M
Home Financials for this Owner
Home Financials are based on the most recent Mortgage that was taken out on this home.
Original Mortgage
$104,000
Interest Rate
6.66%
Purchase Details
Closed on
Jan 18, 2006
Sold by
Morgan Corris S
Bought by
Roundy Nancy K M and Morgan James W
Create a Home Valuation Report for This Property
The Home Valuation Report is an in-depth analysis detailing your home's value as well as a comparison with similar homes in the area
Home Values in the Area
Average Home Value in this Area
Purchase History
| Date | Buyer | Sale Price | Title Company |
|---|---|---|---|
| Cram Thomas Landon | -- | -- | |
| Cram Thomas Landon | -- | -- | |
| Roundy Norman | -- | -- | |
| Roundy Norman | -- | -- | |
| Roundy Nancy K M | -- | -- | |
| Roundy Nancy K M | -- | -- |
Source: Public Records
Mortgage History
| Date | Status | Borrower | Loan Amount |
|---|---|---|---|
| Previous Owner | Cram Thomas Landon | $103,000 | |
| Previous Owner | Roundy Nancy K M | $104,000 |
Source: Public Records
Tax History Compared to Growth
Tax History
| Year | Tax Paid | Tax Assessment Tax Assessment Total Assessment is a certain percentage of the fair market value that is determined by local assessors to be the total taxable value of land and additions on the property. | Land | Improvement |
|---|---|---|---|---|
| 2025 | $1,458 | $165,138 | $63,149 | $101,989 |
| 2024 | $1,458 | $169,417 | $57,436 | $111,981 |
| 2023 | $1,314 | $156,502 | $54,701 | $101,801 |
| 2022 | $1,142 | $134,624 | $42,078 | $92,546 |
| 2021 | $1,037 | $183,492 | $58,850 | $124,642 |
| 2020 | $842 | $144,581 | $53,500 | $91,081 |
| 2019 | $922 | $154,287 | $49,896 | $104,391 |
| 2018 | $828 | $137,340 | $41,580 | $95,760 |
| 2017 | $787 | $124,697 | $37,800 | $86,897 |
| 2016 | $717 | $110,283 | $37,800 | $72,483 |
| 2015 | $596 | $103,714 | $37,800 | $65,914 |
| 2014 | $596 | $91,180 | $40,119 | $51,061 |
| 2013 | -- | $50,149 | $0 | $0 |
Source: Public Records
Map
Nearby Homes
- 0 200 Unit 1409069
- 0 250 E
- 163 E 200 N
- 320 W Los Barancos Ln
- 463 E Deadwood Dr
- 466 E El Valle Dr
- 493 E Donner Cir
- 233 E 100 N
- 190 W Ladera Ln
- 484 E Mohawk Dr
- 500 Mohawk Dr
- 558 E Rainmaker Rd
- 444 Ladera Ln
- Lot 353 Rain Maker Rd
- 639 Rain Maker Rd
- 253 N 240 W Unit 4
- 23 S 100 E
- 197 N 200 W
- 163 N 200 W
- 143 E 100 S Unit 2