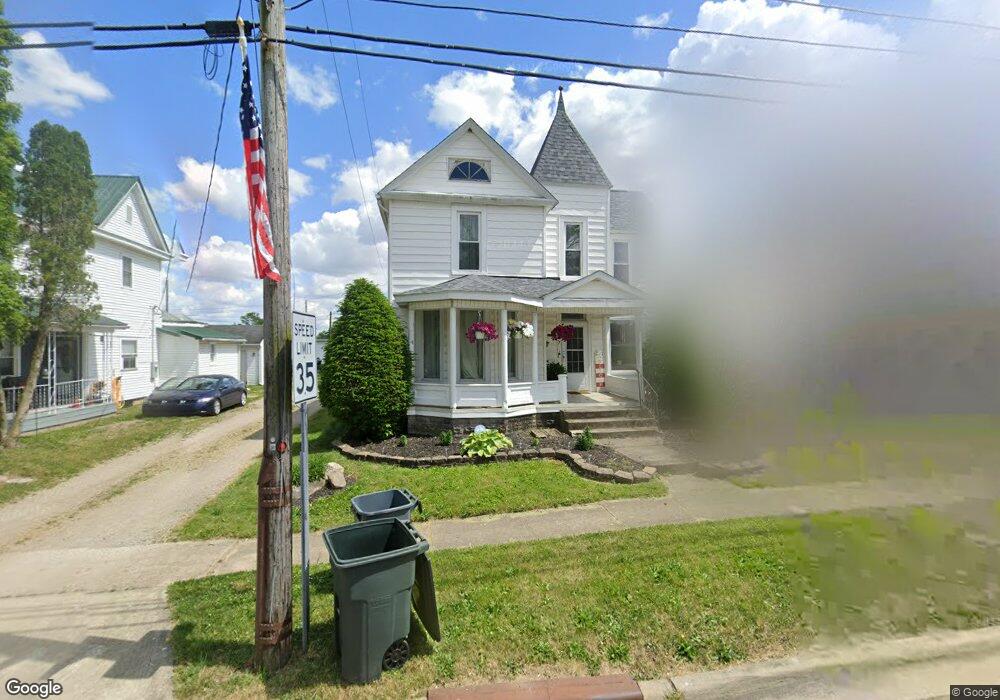
177 E Main St Mount Sterling, OH 43143
Estimated Value: $196,000 - $251,000
3
Beds
2
Baths
1,410
Sq Ft
$157/Sq Ft
Est. Value
About This Home
This home is located at 177 E Main St, Mount Sterling, OH 43143 and is currently estimated at $221,487, approximately $157 per square foot. 177 E Main St is a home located in Madison County with nearby schools including Madison-Plains Elementary School, Madison-Plains Intermediate School, and Madison-Plains Junior High School.
Ownership History
Date
Name
Owned For
Owner Type
Purchase Details
Closed on
May 16, 2008
Sold by
Stone Brandi L
Bought by
Stone Brandi L and Wall Christopher W
Current Estimated Value
Home Financials for this Owner
Home Financials are based on the most recent Mortgage that was taken out on this home.
Original Mortgage
$142,077
Outstanding Balance
$88,995
Interest Rate
6.1%
Mortgage Type
New Conventional
Estimated Equity
$132,492
Purchase Details
Closed on
Feb 20, 2006
Sold by
Equity Trust Co
Bought by
Stone Brandi L
Home Financials for this Owner
Home Financials are based on the most recent Mortgage that was taken out on this home.
Original Mortgage
$110,300
Interest Rate
6.2%
Mortgage Type
Fannie Mae Freddie Mac
Purchase Details
Closed on
Jul 18, 2005
Sold by
Wilson Richard T and Wilson Doris E
Bought by
Equity Trust Co and R Scott Ratcliff Ira
Purchase Details
Closed on
Jun 23, 2005
Sold by
Estate Of Anna R Fulton
Bought by
Wilson Doris E and Wilson Richard T
Create a Home Valuation Report for This Property
The Home Valuation Report is an in-depth analysis detailing your home's value as well as a comparison with similar homes in the area
Purchase History
We collect this data history from publicly available records. To have your information removed, we recommend requesting removal directly through your county’s website.
| Date | Buyer | Sale Price | Title Company |
|---|---|---|---|
| Stone Brandi L | -- | Chicago Title | |
| Stone Brandi L | $137,900 | Midland Title | |
| Equity Trust Co | $86,000 | Midland Title | |
| Wilson Doris E | -- | -- |
Source: Public Records
Mortgage History
We collect this data history from publicly available records. To have your information removed, we recommend requesting removal directly through your county’s website.
| Date | Status | Borrower | Loan Amount |
|---|---|---|---|
| Open | Stone Brandi L | $142,077 | |
| Closed | Stone Brandi L | $110,300 |
Source: Public Records
Tax History
| Year | Tax Paid | Tax Assessment Tax Assessment Total Assessment is a certain percentage of the fair market value that is determined by local assessors to be the total taxable value of land and additions on the property. | Land | Improvement |
|---|---|---|---|---|
| 2025 | $1,528 | $43,540 | $7,780 | $35,760 |
| 2024 | $1,528 | $43,540 | $7,780 | $35,760 |
| 2023 | $1,528 | $43,540 | $7,780 | $35,760 |
| 2022 | $1,344 | $36,190 | $6,470 | $29,720 |
| 2021 | $1,310 | $36,190 | $6,470 | $29,720 |
| 2020 | $1,312 | $36,190 | $6,470 | $29,720 |
| 2019 | $1,039 | $29,490 | $5,800 | $23,690 |
| 2018 | $1,040 | $29,490 | $5,800 | $23,690 |
| 2017 | $1,019 | $29,490 | $5,800 | $23,690 |
| 2016 | $848 | $25,540 | $5,800 | $19,740 |
| 2015 | $832 | $25,540 | $5,800 | $19,740 |
| 2014 | $832 | $25,540 | $5,800 | $19,740 |
| 2013 | -- | $26,810 | $7,010 | $19,800 |
Source: Public Records
Map
Nearby Homes
- 20 S High St
- 129 W Columbus St
- 15825 State Route 207
- 350 W Main St
- 16185 State Route 207
- 13790 Era Rd
- 13289 Tenny Rd
- 13360 U S 62
- 12237 Woods Opossum Run
- 0 Clarks Run Rd
- Lot 3 Five Points Pike
- Lot 2 Five Points Pike
- 0 Federal Rd
- 12281 London Rd
- 10977 Mckendree Rd
- 15050 Drummond Rd
- 9380 Rockwell Rd Unit NE
- 11734 Kellough Rd
- 12343 State Route 316
- 12764 Cleo Rd
Your Personal Tour Guide
Ask me questions while you tour the home.