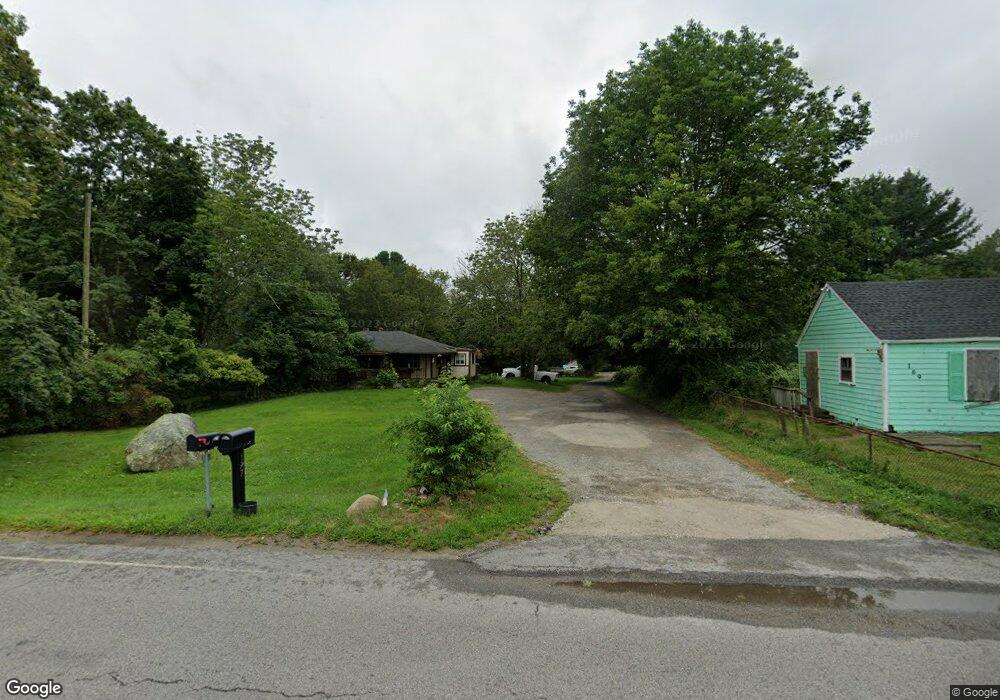
177 Gifford Rd Westport, MA 02790
North Westport NeighborhoodEstimated Value: $451,000 - $587,000
3
Beds
2
Baths
1,600
Sq Ft
$319/Sq Ft
Est. Value
About This Home
This home is located at 177 Gifford Rd, Westport, MA 02790 and is currently estimated at $510,626, approximately $319 per square foot. 177 Gifford Rd is a home located in Bristol County with nearby schools including Alice A. Macomber Primary School, Westport Elementary School, and Westport Middle-High School.
Ownership History
Date
Name
Owned For
Owner Type
Purchase Details
Closed on
Jan 11, 2013
Sold by
Leite Armando and Leite Leovigilda
Bought by
Leite Ft
Current Estimated Value
Purchase Details
Closed on
Jan 7, 2011
Sold by
Wells Fargo Bk
Bought by
Leite Armando and Leite Leovigilda
Purchase Details
Closed on
Dec 21, 2010
Sold by
Vallee-Hart Kerri L and Wells Fargo Bank Na Tr
Bought by
Wells Fargo Bank Na Tr
Create a Home Valuation Report for This Property
The Home Valuation Report is an in-depth analysis detailing your home's value as well as a comparison with similar homes in the area
Home Values in the Area
Average Home Value in this Area
Purchase History
| Date | Buyer | Sale Price | Title Company |
|---|---|---|---|
| Leite Ft | -- | -- | |
| Leite Armando | $135,000 | -- | |
| Wells Fargo Bank Na Tr | $169,457 | -- |
Source: Public Records
Mortgage History
| Date | Status | Borrower | Loan Amount |
|---|---|---|---|
| Previous Owner | Wells Fargo Bank Na Tr | $264,000 | |
| Previous Owner | Wells Fargo Bank Na Tr | $218,000 | |
| Previous Owner | Wells Fargo Bank Na Tr | $95,000 |
Source: Public Records
Tax History Compared to Growth
Tax History
| Year | Tax Paid | Tax Assessment Tax Assessment Total Assessment is a certain percentage of the fair market value that is determined by local assessors to be the total taxable value of land and additions on the property. | Land | Improvement |
|---|---|---|---|---|
| 2025 | $2,918 | $391,700 | $168,700 | $223,000 |
| 2024 | $2,859 | $369,800 | $149,800 | $220,000 |
| 2023 | $2,725 | $334,000 | $136,400 | $197,600 |
| 2022 | $2,582 | $304,500 | $136,400 | $168,100 |
| 2021 | $2,420 | $280,800 | $112,700 | $168,100 |
| 2020 | $2,329 | $276,300 | $108,200 | $168,100 |
| 2019 | $2,240 | $270,900 | $108,200 | $162,700 |
| 2018 | $2,084 | $255,100 | $109,500 | $145,600 |
| 2017 | $1,982 | $248,700 | $106,000 | $142,700 |
| 2016 | $1,834 | $231,800 | $102,500 | $129,300 |
| 2015 | $1,741 | $219,600 | $104,800 | $114,800 |
Source: Public Records
Map
Nearby Homes