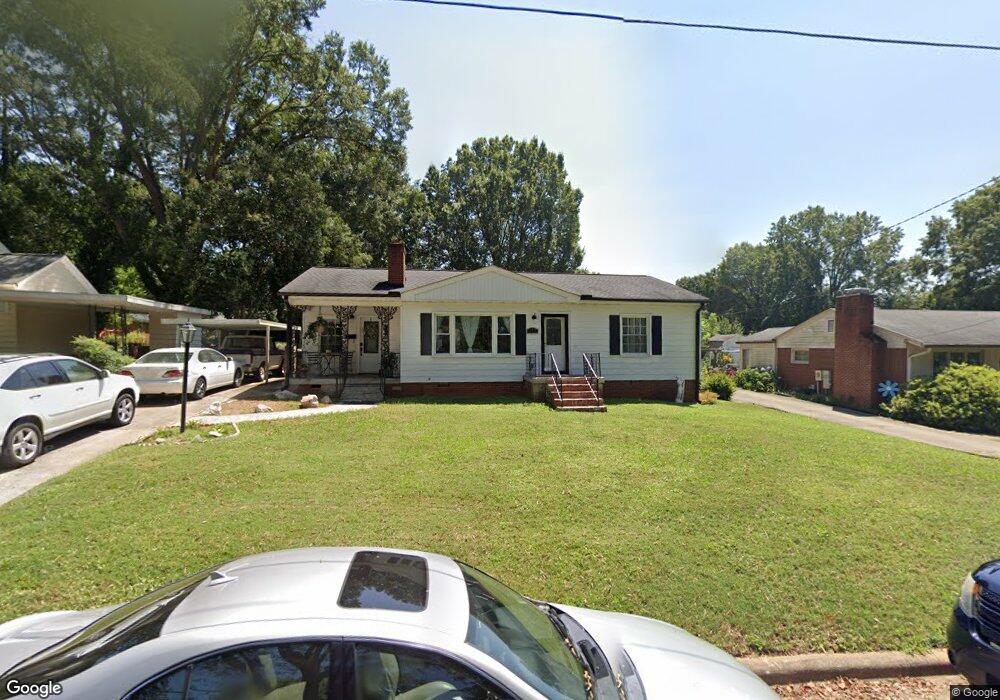
177 Hillside Ave SW Concord, NC 28025
Estimated Value: $221,000 - $292,000
2
Beds
1
Bath
1,192
Sq Ft
$209/Sq Ft
Est. Value
About This Home
This home is located at 177 Hillside Ave SW, Concord, NC 28025 and is currently estimated at $248,891, approximately $208 per square foot. 177 Hillside Ave SW is a home located in Cabarrus County with nearby schools including R Brown Mcallister STEMElementary, Concord Middle School, and Concord High School.
Ownership History
Date
Name
Owned For
Owner Type
Purchase Details
Closed on
Oct 31, 2023
Sold by
Crosby Lorrie Chaffee and Crosby Tracy
Bought by
Chaffee Crosby Lorric and Tracy Crosby Tracy
Current Estimated Value
Purchase Details
Closed on
Mar 23, 2021
Sold by
Chaffee Judy I and Nave James
Bought by
Crosby Lorrie Chaffee
Home Financials for this Owner
Home Financials are based on the most recent Mortgage that was taken out on this home.
Original Mortgage
$125,000
Interest Rate
2.73%
Mortgage Type
New Conventional
Purchase Details
Closed on
Sep 10, 1998
Sold by
Sowers Mabel Smith and Smith David Lee
Bought by
Chaffee Fred E and Chaffee Judy I
Home Financials for this Owner
Home Financials are based on the most recent Mortgage that was taken out on this home.
Original Mortgage
$71,000
Interest Rate
6.79%
Create a Home Valuation Report for This Property
The Home Valuation Report is an in-depth analysis detailing your home's value as well as a comparison with similar homes in the area
Home Values in the Area
Average Home Value in this Area
Purchase History
| Date | Buyer | Sale Price | Title Company |
|---|---|---|---|
| Chaffee Crosby Lorric | -- | None Listed On Document | |
| Crosby Lorrie Chaffee | $142,000 | None Available | |
| Chaffee Fred E | $74,500 | -- |
Source: Public Records
Mortgage History
| Date | Status | Borrower | Loan Amount |
|---|---|---|---|
| Previous Owner | Crosby Lorrie Chaffee | $125,000 | |
| Previous Owner | Chaffee Fred E | $71,000 |
Source: Public Records
Tax History Compared to Growth
Tax History
| Year | Tax Paid | Tax Assessment Tax Assessment Total Assessment is a certain percentage of the fair market value that is determined by local assessors to be the total taxable value of land and additions on the property. | Land | Improvement |
|---|---|---|---|---|
| 2025 | $2,548 | $255,840 | $80,000 | $175,840 |
| 2024 | $2,293 | $230,230 | $80,000 | $150,230 |
| 2023 | $1,535 | $125,840 | $37,000 | $88,840 |
| 2022 | $1,535 | $125,840 | $37,000 | $88,840 |
| 2021 | $1,535 | $125,840 | $37,000 | $88,840 |
| 2020 | $1,535 | $125,840 | $37,000 | $88,840 |
| 2019 | $1,276 | $104,550 | $32,000 | $72,550 |
| 2018 | $1,255 | $104,550 | $32,000 | $72,550 |
| 2017 | $1,234 | $104,550 | $32,000 | $72,550 |
| 2016 | $732 | $101,930 | $32,000 | $69,930 |
| 2015 | $1,203 | $101,930 | $32,000 | $69,930 |
| 2014 | $1,203 | $101,930 | $32,000 | $69,930 |
Source: Public Records
Map
Nearby Homes
- 85 Myrtle Ave SW
- 671 Sedgefield St SW
- 569 Union St S
- 571 Union St S
- 736 Spring St SW
- 23 Lawndale Ave SE
- 229 Boger Ct SW
- 522 Sunnyside Dr SE
- 159 Fryling Ave SW
- 80 Pounds Ave SW
- 336 Lincoln St SW
- 60 Patton Ct SE
- 341 Broad Dr SW Unit 4
- 782 Union St S
- 358 Cozart Ave SW
- 360 Spring St SW
- 355 Melrose Dr SW Unit B
- 355 Melrose Dr SW Unit A
- 355 Melrose Dr SW Unit F
- 783 Union St S
- 171 Hillside Ave SW
- 183 Hillside Ave SW
- 176 Miller Ave SW
- 189 Hillside Ave SW
- 165 Hillside Ave SW
- 170 Miller Ave SW
- 182 Miller Ave SW
- 164 Miller Ave SW
- 188 Miller Ave SW
- 170 Hillside Ave SW
- 180 Hillside Ave SW
- 195 Hillside Ave SW
- 186 Hillside Ave SW
- 166 Hillside Ave SW
- 159 Hillside Ave SW
- 158 Miller Ave SW
- 194 Hillside Ave SW
- 192 Hillside Ave SW
- 160 Hillside Ave SW
- 203 Hillside Ave SW