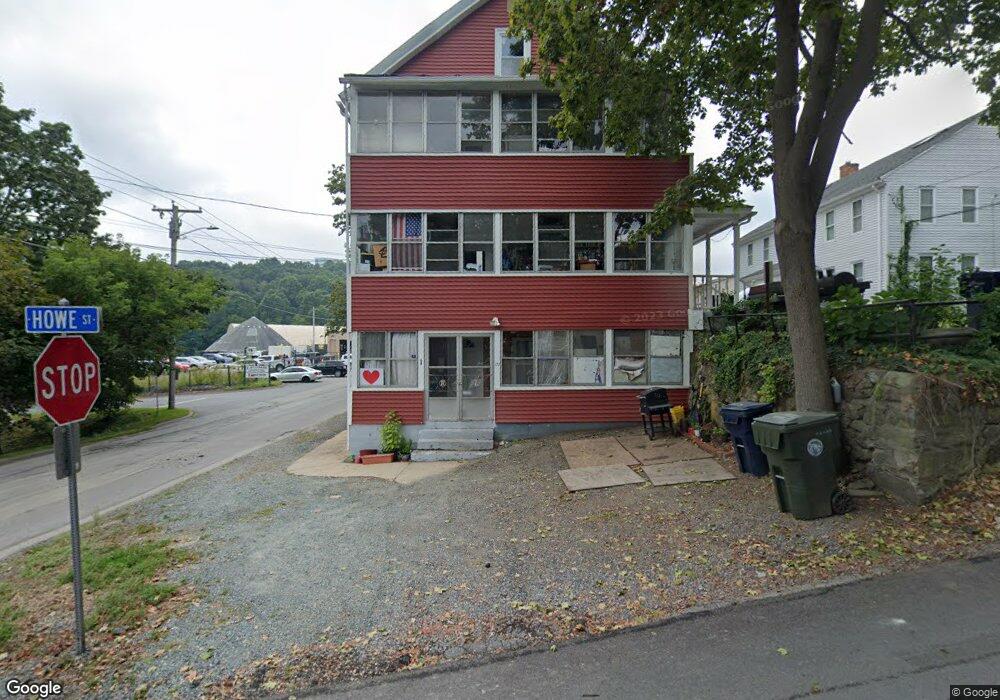
177 Howe St Marlborough, MA 01752
Estimated Value: $733,000 - $872,000
8
Beds
3
Baths
2,957
Sq Ft
$272/Sq Ft
Est. Value
About This Home
This home is located at 177 Howe St, Marlborough, MA 01752 and is currently estimated at $804,053, approximately $271 per square foot. 177 Howe St is a home located in Middlesex County with nearby schools including Marlborough High School, Advanced Math & Science Academy, and New Covenant Christian School.
Ownership History
Date
Name
Owned For
Owner Type
Purchase Details
Closed on
Dec 10, 2002
Sold by
Wagner Charles F and Wagner Janice H
Bought by
Basmaji Joseph
Current Estimated Value
Home Financials for this Owner
Home Financials are based on the most recent Mortgage that was taken out on this home.
Original Mortgage
$354,438
Outstanding Balance
$153,342
Interest Rate
6.34%
Mortgage Type
Purchase Money Mortgage
Estimated Equity
$650,711
Purchase Details
Closed on
May 30, 1990
Sold by
Naves Dora A
Bought by
Wagner Charles F
Create a Home Valuation Report for This Property
The Home Valuation Report is an in-depth analysis detailing your home's value as well as a comparison with similar homes in the area
Home Values in the Area
Average Home Value in this Area
Purchase History
| Date | Buyer | Sale Price | Title Company |
|---|---|---|---|
| Basmaji Joseph | $360,000 | -- | |
| Wagner Charles F | $171,000 | -- |
Source: Public Records
Mortgage History
| Date | Status | Borrower | Loan Amount |
|---|---|---|---|
| Open | Basmaji Joseph | $354,438 | |
| Previous Owner | Wagner Charles F | $30,000 | |
| Previous Owner | Wagner Charles F | $233,247 | |
| Previous Owner | Wagner Charles F | $228,500 |
Source: Public Records
Tax History Compared to Growth
Tax History
| Year | Tax Paid | Tax Assessment Tax Assessment Total Assessment is a certain percentage of the fair market value that is determined by local assessors to be the total taxable value of land and additions on the property. | Land | Improvement |
|---|---|---|---|---|
| 2025 | $5,584 | $566,300 | $156,800 | $409,500 |
| 2024 | $5,163 | $504,200 | $142,500 | $361,700 |
| 2023 | $5,599 | $485,200 | $112,300 | $372,900 |
| 2022 | $5,525 | $421,100 | $107,000 | $314,100 |
| 2021 | $5,702 | $388,400 | $87,200 | $301,200 |
| 2020 | $5,612 | $354,900 | $84,900 | $270,000 |
| 2019 | $4,789 | $340,400 | $83,300 | $257,100 |
| 2018 | $4,156 | $284,100 | $75,400 | $208,700 |
| 2017 | $4,081 | $266,400 | $75,400 | $191,000 |
| 2016 | $3,513 | $229,000 | $75,400 | $153,600 |
| 2015 | $3,106 | $197,100 | $80,000 | $117,100 |
Source: Public Records
Map
Nearby Homes